£254
Average scrap quote value in 2025
+ £36vs 2024 avg price of £218 quote value
First-party data on scrap car pricing, volume, regional trends, vehicle characteristics, fuel type breakdowns, seasonal patterns and the environmental story behind the numbers. The most comprehensive scrap car dataset in the UK.

Award-winning CEO driving growth and social impact across automotive, recycling, and technology-led enterprise platforms.
Before diving in, these four numbers define the UK scrap car market in 2025. Each one tells a different part of the same story: what's getting scrapped, what it's worth, how old it is and how much of the market we've analysed to get here.
Average scrap quote value in 2025
Make with the most scrap enquiries for the 4th year running
Average age of a car assessed for scrappage
Scrap enquiries and collections in 2025
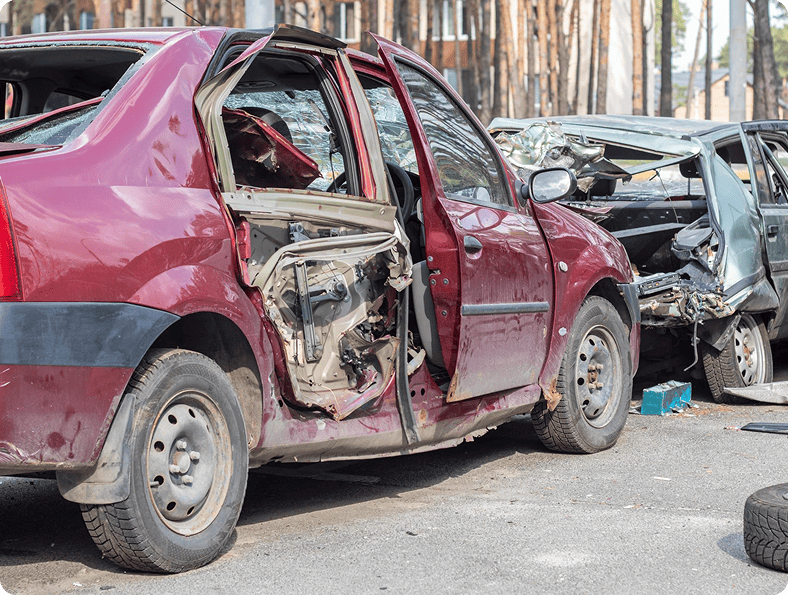
Every car reaches a tipping point, and ultimately it comes down to costs vs value. Cars depreciate, and they eventually reach a point where the mounting repair costs are more expensive than the value of the car itself. When that happens, the easiest option (and possibly the only one) is to scrap your car.
Based on our analysis of 461,991 vehicles, the typical car reaches this point when it’s 16.6 years old, has covered 118,493 miles and has passed through 4+ owners before reaching end of life. At that age and mileage, the economics of repair hardly ever stack up, and for a growing number of owners, regulatory pressure from schemes like ULEZ is accelerating that decision before the car reaches natural end of life.
Only 8.9% of scrapped cars still had their original owner at the point of scrappage. Every time a car changes hands, the new owner takes on an ageing vehicle with less certainty about its history. By the time it reaches owner four or five, the people most likely to absorb a big repair bill are the least likely to. They paid the least for the car, they have the least emotional attachment and scrapping is a clean exit.
 STEP 1
Only ATFs can legally scrap your vehicle. Using an unlicensed scrap yard means the car won't be formally deregistered, and you’re still liable for it.
STEP 2Contact your chosen ATF or use an online service to get a quote. Once confirmed, collection is typically arranged within 24 hours.
STEP 3Give the yellow 'Sell, transfer or part-exchange' section of your V5C at the point of collection. Keep the rest until the DVLA confirms the vehicle is off the road.
STEP 4Informing the DVLA is the ATF’s responsibility, but verify this yourself too. Because if they aren’t notified, you could receive a £1,000 fine.
STEP 5Your ATF must issue a Certificate of Destruction within seven days of scrapping your car. This proves you’re no longer tied to it.
STEP 6Full months of remaining road tax are refunded automatically once scrappage is confirmed. You’ll get a cheque in the post within six weeks.
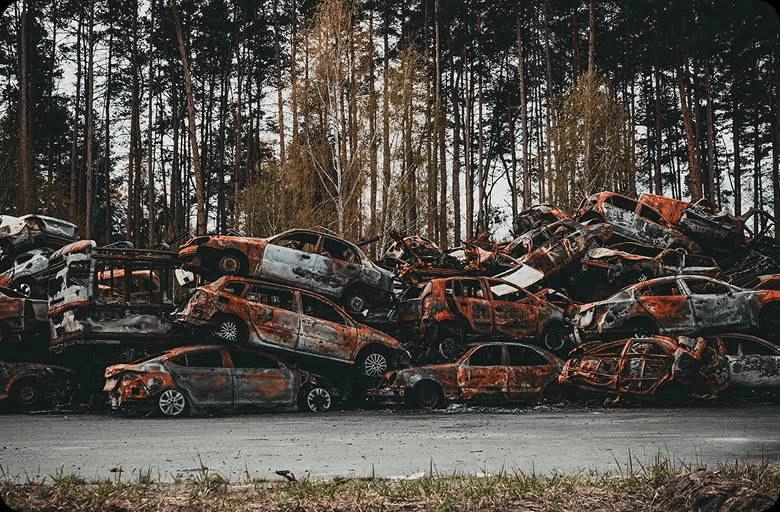
Scrapping a car through a legit ATF is the most environmentally responsible way to dispose of a vehicle. The UK's End-of-Life Vehicles Directive sets strict recovery targets for metal scrap yards, and the data shows the industry is meeting them.
99.82% of cars in our dataset run on petrol or diesel, each carrying between 10 and 30+ litres of hazardous engine oil, coolant, brake fluid, fuel and refrigerant at the point of collection. Across next to half a million vehicles, that's an estimated 4.6 to 13.8 million litres requiring safe extraction every year — enough to fill up to 3.5 Olympic swimming pools — before a single piece of steel is touched.
From first quote to Certificate of Destruction, the process is faster than most people expect. Based on our 2025 data, 78.4% of vehicles are collected the same day the deal is confirmed, and 98.9% get picked up within a week. Average time from confirmation to collection: 0.8 days. As a driver, that settles your responsibility. The ATF completes their end within 7 days.
Across the 461,991 vehicles in our data set, the average scrap car is worth £254. But there’s a huge amount of variance; the actual range runs from £0 to £8,059, and where your car falls depends almost entirely on what it's made of and how heavy it is.
Scrap car value is driven primarily by weight. Heavier cars contain more recoverable metal, and more metal means a higher scrap offer. This is why German premium brands consistently outvalue French and Italian city cars at the scrapyard, regardless of their condition or mileage.
The primary driver. More steel and aluminium = higher offer. Heavier body types consistently return more.
Convertibles and SUVs outvalue hatchbacks pound for pound, purely due to construction mass.
Moderate negative effect. Older cars return less, but premium makes hold value better than budget brands as they age.
Missing catalytic converter, stripped components or severe damage will reduce the offer significantly.
Our data confirms this strong positive relationship with a Pearson correlation of r = +0.67 between estimated vehicle weight and scrap price. Age has the opposite effect at r = -0.42, but it's a weaker relationship than most people assume. A well-built 20-year-old BMW can still outvalue a 10-year-old Fiat.
r = +0.67 - strong positive
r = -0.42 - moderate negative
"Our data captures the metal value side of the equation, but parts recovery is where the real upside sits. If you sell to a buyer who doubles as a car breaker, a working engine, catalytic converter, alloy wheels and serviceable body panels all add significantly to what you're offered compared with a buyer quoting on steel weight alone. If you get a scrap quote with Car.co.uk, you’re getting that factored in as well."
The lowest recorded average scrap value of any make in our 2025 dataset was Daewoo at £142. This reflects both the age and scarcity of parts demand for a brand that left the UK market over two decades ago.
Below is a closer look at how that’s changed over the past five years.
The body style of your car is one of the most consistent predictors of scrap value, and the ranking barely shifts year on year. In fact, the order from lowest to highest didn’t change at all from 2021 to 2025.
Convertibles top the table every single year across our entire dataset, and the reason surprises most people (it's not desirability). In 2025 the average convertible returned £317.41 — £83.80 more than the average hatchback — because of its construction. A convertible roof requires significant chassis reinforcement to compensate for the missing structural rigidity of a fixed roof. That extra steel goes directly into the scrap value.
Hatchbacks sit at the bottom every year (£233.61 in 2025), not because they're undesirable, but because they're the lightest mainstream body style in the UK market. They also dominate volume, accounting for 56.5% of all vehicles in our dataset in 2025. The most commonly scrapped body style is the least valuable per unit. That's the fundamental tension in the scrap market.
While the average scrap value across our dataset was £254, 6.4% of vehicles returned over £500, and 2.9% received under £100. Based on our scrap quote data, the most common band for 2025 was actually the £100 to £200 range, which accounted for 21.5% of all scrap vehicle offers.
The distribution has shifted pretty dramatically over the four years. In 2021 the modal band was £200-£300 by a mile. By 2024-25 the £100-200 band has exploded with 198k transactions in 2025 vs just 22k in 2021. The £200-3300 band is still big but now neck-and-neck with £100-£200 rather than dominant. Scrap values have been shrinking (for ferrous metals like steel in particular) because of lower demand and higher market volatility.
In 2025, the North West returns the highest average scrap price at £277, with London close behind at £276. The lowest is Northern Ireland at £218, though that's based on just two transactions and shouldn't be treated as representative. Among regions with meaningful volume, the North East at £242 and East of England at £236 consistently sit at the lower end.
ATF density. Regions with more ATFs competing for vehicles tend to return higher offers simply because there's more buyer competition.
Collection economics. ATFs factor in transport costs, so remote areas like Northern Ireland and parts of Scotland face structural price pressure.
Vehicle mix. Higher proportions of heavier, premium vehicles in the scrap pool skew data higher in areas like London and the South East.
Around 95% of a scrap car's weight is recovered or recycled. This is a legal requirement under the UK's End-of-Life Vehicles Directive, and it’s one the industry has consistently met. This means only around 5% ends up in landfill. In 2025, the total material processed from our dataset alone came to 607,056 tonnes. That's the equivalent of 54.1 Eiffel Towers!
Scrap metal prices dictate the majority of what a scrap car is worth. Currently, the scrap metal in a car is worth about £193 per tonne, 27.4% down from its peak of £266 in 2022. Around 65% of a car's weight is ferrous metal — steel primarily — and at current market rates of £140-180 per tonne, that's the single biggest driver of your scrap offer. The remaining material value comes from non-ferrous metals like aluminium and copper, which make up around 5% of vehicle weight but command higher prices per tonne.
Below, you’ll see the relationship between ferrous and non-ferrous tonnage and overall scrap values over the last five years.
The CIWM estimates between 1.6 and 2 million end-of-life vehicles are scrapped annually in the UK. For context, the EU recorded 4.7 million ELVs in 2022 (though the UK has not reported into Eurostat since Brexit, making direct comparison difficult).
The most consistent pattern across five years is the gradual northward shift of UK scrappage activity. In 2021 and 2022, the South West and Yorkshire dominated the regional picture. By 2025, the North West had become the single largest scrappage region in the UK, growing from 11.8% share in 2022 to 18.0% in 2025.
London tells the opposite story: a 10.7% share in 2021 has more than halved to 6.7% in 2025, which reflects lower overall (and decreasing) car dependence in the UK’s capital. The data suggests scrappage is consolidating in England's northern and midland regions — areas with higher car dependency, older vehicle fleets, and greater proximity to the ATF network.
Scrappage activity isn't evenly distributed across the year, but the patterns make a lot of sense once you understand the triggers. March consistently emerges as a peak month for scrap enquiries and collections because of the spring MOT cycle: vehicles failing their annual test in Q1 face repair bills that tip owners toward scrapping rather than fixing. June and November tend to be the quietest months across our dataset, both of which reflect holiday season inertia.
| Period | Pattern | Likely reason |
|---|---|---|
| March | Peak | Spring MOT cycle — Q1 failures trigger scrappage decisions |
| Apr-May | Elevated | Post-MOT decisions being acted on, winter damage assessed |
| Jun-Jul | Trough | Vacation season — owners deferring major decisions |
| Aug-Sep | Recovery | Return from summer, autumn vehicle assessments |
| Nov-Dec | Decline | Year-end inertia, reluctance to be without a car in winter |
The mileage at which a car reaches the scrapyard varies significantly depending on where in the UK it's been driven. The pattern comes down to one fundamental difference: city driving versus motorway miles. Stop-start urban traffic puts disproportionate wear on a car’s brakes, clutch and gearbox, and the engine rarely reaches its optimal operating temperature on short journeys. Motorway driving is comparatively gentle: steady RPM, consistent temperature and less mechanical stress. The data from Scrap Car Comparison's 2025/26 Scrap Car Report — which requires a minimum of 100 entries per location to qualify — illustrates this starkly.
According to Scrap Car Comparison's data, London accounts for eight of the ten worst areas for mileage at scrappage. Kirkcaldy and Kilmarnock are the only non-London entries in the bottom ten.
At the other end, Belfast tops the best mileage table. This is a counterintuitive result for a city, but one that reflects Northern Ireland's driving patterns, which tend toward longer, steadier journeys on less congested roads.
Vauxhall has held the top spot as the UK's most scrapped make every single year in our scrap quote and transaction data. And in 2025 it extended its lead, accounting for 17.2% of all vehicles in our scrap car dataset. The Ford Fiesta takes the crown for the most scrapped model in 2025 with 6,549 vehicles, reclaiming the top spot from the Vauxhall Corsa which led in 2024. The data largely reflects UK car buying patterns from 15 to 20 years ago.
"The scrapyard is a time capsule. The cars people are looking to scrap today tell you what Britain was buying 15-20 years ago. The cars being bought today tell you what the scrapyard will look like in 2040."
Hatchbacks dominate the UK scrappage market by a massive margin, and have done so every year since we started recording this data. In 2025, 56.5% of all the vehicles entering our platform were hatchbacks. But the story within the data is about what's changing: hatchback share has fallen from 66.8% in 2021 to 56.5% in 2025 as SUVs and estates take a growing proportion of the scrappage pie. The cars entering the scrappage process today were bought 15-20 years ago, when the hatchback was the default UK purchase. That’s not the case anymore.
Silver is the most common colour for end-of-life vehicles in the UK, and it’s been that way for the past half-decade. But its dominance is fading. In 2021, silver accounted for 30.0% of all scrap quoted vehicles. By 2025 that’s fallen to 23.6%. The reason is simple: silver was the UK's most popular new car colour through the late 1990s and 2000s, exactly the era now hitting peak scrappage age. As those vehicles clear the system, silver's share will continue to fall.
The reverse is true for white. Just 2.3% of the vehicles we analysed were white in 2021. By 2025 that had risen to 8.8%. White became the UK's most popular new car colour around 2012 and has held that position since — meaning the white wave is just beginning to enter the scrappage cycle. In ten years, white will likely be the most scrapped colour in the UK.
White will become the #1 most scrapped colour by around 2030-32.
Grey will overtake blue and potentially silver as grey has been the UK's fastest growing new car colour since 2015.
Silver will continue declining toward 10-12% by 2035.
Black will hold relatively steady as it's been consistently popular.
Green's tiny 1.9% share will keep falling; it's the remnant of a 1990s trend with no modern equivalent.
82.7% of vehicles in our dataset in 2025 were manual, simply because manual was the default for the vast majority of new car sales up until recently. But we can already see shift toward automatics in the scrappage data, with the segment growing from 10.9% in 2022 to 13.8% in 2025.
According to new car sales data, 78% of new cars sold in 2024 had automatic gearboxes. So that trend will accelerate dramatically over the next decade as the current generation of automatic-dominated new car sales ages into scrappage territory.
The most common number of previous owners for an end-of-life vehicle in the UK is three. This number accounts for 19.2% of all vehicles in our 2025 dataset. The average number of prior owners sits at 4.2 across all years. And at the extreme end, 3.3% of the vehicles in our dataset had 10 or more previous owners. Also worth mentioning is the fact that, across our five years of reporting data, the distribution is remarkably stable. Ownership patterns at scrappage barely shift at all.
The number of owners is a proxy for how much the car was valued and how quickly its condition deteriorated. A 17-year-old car with 1 owner was likely well-maintained, probably garaged, possibly a company car. It reached scrappage through age or a single catastrophic event. A 17-year-old car with 8 owners was passed down the chain as value declined, each successive owner paying less, investing less, maintaining less. Same age, completely different lifecycle.
These are vehicles that have been traded or sold so many times they've essentially become disposable assets. They're passed between budget buyers, possibly used for parts stripping between sales, or run into the ground by successive owners who had no long-term stake in the vehicle. It's the automotive equivalent of a tenancy chain where each occupant leaves it slightly worse than they found it.
The average ELV in the UK has covered 118,493 miles, or roughly five times around the circumference of Great Britain. The median sits slightly lower at 114,655 miles, meaning half of all vehicles we analysed have covered less than that. Mileage at scrappage has grown consistently across our five-year dataset, rising from 111,944 miles in 2021. What this tells us is that cars are lasting longer before reaching end of life.
The average end-of-life vehicle in the UK is 16.6 years old, and that figure has barely moved across our five years of reporting data. What has shifted is the composition within that average.
What you’ll notice is that the 15-20 year bracket has been the dominant band every year without exception. However, the 20-25 year bracket is growing steadily, from 9.2% in 2021 to 17.7% in 2025. This is happening as newer vehicles last longer and, as a result, owners hold onto cars longer before scrapping.
According to internal data from Scrap Car Comparison, the makes that survive longest before scrapping fall into two distinct groups: discontinued brands and brands known for reliability.
| Make | Avg age | Vs overall average |
|---|---|---|
| Rover | 22.9 yrs | +33% |
| MG | 20.9 yrs | +21% |
| Mercedes | 19.1 yrs | +11% |
| Jaguar | 19.0 yrs | +10% |
| Land Rover | 19.0 yrs | +10% |
| Saab | 18.9 yrs | +9% |
| Toyota | 18.9 yrs | +9% |
| Volvo | 18.8 yrs | +9% |
| Volkswagen | 18.7 yrs | +8% |
| Honda | 18.6 yrs | +8% |
Rover (22.9 yrs) and Saab (18.9 yrs) appear because their youngest examples are already beyond the average scrap age. It's not that Rover owners are loyal - it's that there are no young Rovers left. The brand died in 2005, so every Rover being scrapped today is at least 20 years old by definition.
Toyota, Volvo, Honda and Volkswagen all appear in the "oldest" list, and they're the same brands celebrated for longevity. The insight: reliable cars don't avoid the scrapyard, they just arrive later. A Toyota being scrapped at 18.9 years has probably outlasted two or three Fiestas.
Mercedes, Jaguar and Land Rover averaging 19+ years suggests owners invest more in keeping them running - repair bills that would condemn a budget car get absorbed because the vehicle still has perceived value.
Petrol and diesel account for 99.8% of every ELV in our 2025 dataset. What you can take from this is that the EV transition has not yet reached the scrapyard in any meaningful way — just 235 electric vehicles appeared across 461,991 total. But the direction of travel is clear, and the fuel type data across five years tells a story about where the UK fleet has been, and where the scrapyard is heading.
The most striking shift in our data isn't the EV numbers, though. It's diesel. In 2021, diesel accounted for just 23.5% of vehicles in the dataset. By 2024 that had surged to 46.3% before pulling back slightly to 43.9% in 2025. This reflects the large volume of diesel vehicles sold during the UK's diesel boom of the mid-2000s to mid-2010s now reaching peak scrappage age, and the accelerating exit of older diesels driven by pressures from ULEZ and Clean Air Zone expansion.
Just 235 electric vehicles appeared in our 2025 dataset, or 0.05% of nearly half a million vehicles analysed. The reason is that the UK's EV fleet is too young to be dying. The Nissan Leaf, launched in 2010 as the first mass-market electric vehicle available in the UK, is only 15 years old (still below the ~17-year average scrap age). The EVs sold in volume from 2015 onwards haven't reached end of life yet, and won't for another five to ten years.
As of September 2025, there are currently 1.76 million licensed zero-emission vehicles on UK roads, but that’s only 4.2% of the total fleet. Electric vehicles accounted for 19.8% of all new car sales in 2024, with the industry achieving an overall ZEV mandate compliance rate of 24.3% against the 22% target when flexibility mechanisms are included. That target rises to 80% by 2030 and 100% by 2035.
In other words, the scrapyard won't feel that wave until the mid-2030s. But when it arrives, it will reshape the entire industry.
Hybrids last significantly longer than petrol or diesel equivalents before reaching the scrapyard — covering more than twice the mileage of a typical petrol vehicle.
Car.co.uk's own data covering 2021-2026 recorded 449 electric entering our platform in total. Nissan leads with 84 EVs scrapped, more than double second-placed Renault at 38. Both are first-generation EVs where battery degradation is the primary scrappage trigger rather than age or mechanical failure.
While data is limited, EVs arriving at the scrapyard today are significantly younger than the average ICE vehicle. The majority are under 10 years old and primarily reach the end of their lives through accident damage or battery degradation rather than age. The oldest examples (early Nissan Leafs from 2010-13) are only now barely approaching the 17-year average scrap age threshold.
Weight-based pricing undersells an EV. The real value is in the battery pack and the copper within it. A typical EV carries around 83 kilograms of copper, and scrap-grade copper trades at £6 to £7 per kilogram, giving it a value of roughly £500 to £580 on copper alone. Battery replacement costs upwards of £5,000, so this is often the point where degradation makes repair uneconomical.
Lithium, nickel, cobalt, manganese
Why it matters
High-demand critical minerals with constrained supply chains.
Copper windings (~83kg per vehicle)
Why it matters
~£500+ at current market rates.
Copper, aluminium
Why it matters
Higher concentration than equivalent ICE components.
Ferrous metal
Why it matters
Same weight-based value as any ICE vehicle.
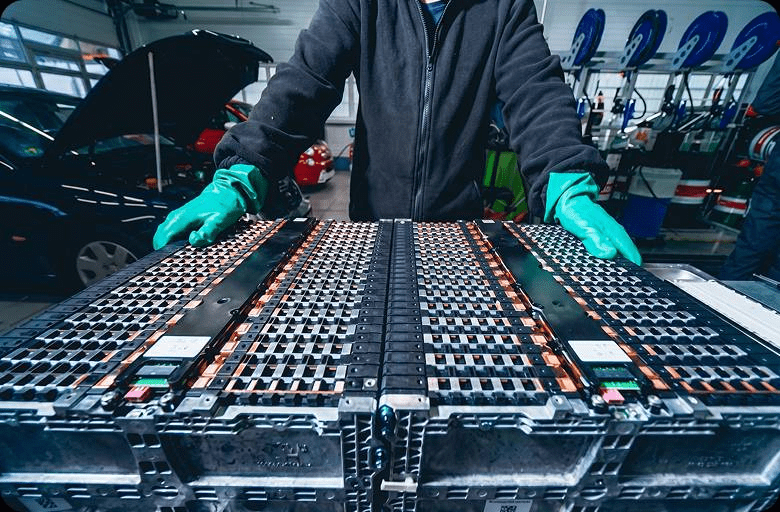
UK company Altilium's EcoCathode™ process can recover over 95% of critical cathode metals, including lithium, nickel and cobalt, from end-of-life battery packs, with an independent lifecycle assessment finding the recycled materials carry up to 74% lower carbon emissions than equivalent materials mined from a Chinese supply chain. Their ACT3 facility in Plymouth, funded with £18.5 million from the government's DRIVE35 Scale-Up Fund, will process 24,000 EV batteries per year when it commissions in 2027. It’s the first commercial-scale operation of its kind in the UK. Until that infrastructure matures, most UK battery waste is exported to Asia for processing, taking the material value and the jobs with it.
“Not every ATF is able to handle EV batteries, as it requires special equipment and additional certifications. Before scrapping your electric vehicle, make sure you’re taking it to ATF that specifically certifies EV handling, and they may return significantly more than a standard scrap offer.”
When an insurer writes off a vehicle, they assign it a salvage category that determines what can legally happen to it next. The four salvage categories in the UK are A, B, S and N.
| Category | Definition | What happens to it |
|---|---|---|
| Cat A | Severe structural damage - beyond any repair | Entire vehicle crushed, no parts salvageable |
| Cat B | Severe structural damage | Body shell crushed, but parts can be removed and resold |
| Cat S | Structural damage - repairable | Can be repaired and returned to the road with disclosure |
| Cat N | Non-structural damage - repairable | Can be repaired and returned to the road with disclosure |
Cat S and Cat N are the categories that drive the salvage market. Cat N is the highest-volume category and increasingly controversial: more than one in three Cat N write-offs may never have needed to enter the salvage system at all.
Ford leads the salvage market, which is a different story to scrap, where Vauxhall dominates.
| Rank | Manufacturer | Salvage share | Change from 2024 |
|---|---|---|---|
| 1 | Ford | 15.7% | = |
| 2 | Vauxhall | 8.7% | = |
| 3 | Volkswagen | 7.7% | = |
| 4 | Nissan | 6.2% | +3 |
| 5 | BMW | 5.9% | -1 |
| 6 | Peugeot | 4.8% | -1 |
| 7 | Mercedes | 4.5% | -1 |
| 8 | Toyota | 4.4% | +2 |
| 9 | Citroen | 4.3% | = |
| 10 | Audi | 4.0% | -4 |
One thing you might notice is that Nissan jumped three places to fourth. This is due to the fact that the Qashqai and Juke entered the most salvaged models list. These are both popular, relatively modern SUVs with strong parts demand.
The Ford Fiesta and Ford Focus hold the top two positions in the most salvaged list.
| Rank | Model | Salvage share | Change from 2024 |
|---|---|---|---|
| 1 | Ford Fiesta | 4.7% | +1 |
| 2 | Ford Focus | 4.6% | +1 |
| 3 | Vauxhall Corsa | 2.6% | -2 |
| 4 | Volkswagen Polo | 2.4% | New entry |
| 5 | Nissan Qashqai | 2.4% | New entry |
| 6 | BMW 3 Series | 2.3% | -1 |
| 7 | Volkswagen Golf | 2.0% | -3 |
| 8 | Vauxhall Astra | 1.9% | -2 |
| 9 | BMW 1 Series | 1.4% | +1 |
| 10 | Nissan Juke | 1.4% | New entry |
The 28,414-mile and five-year gap between the average salvaged and collected/scrapped vehicle tells the clearest possible story: salvage is what happens when a good car has a bad day. Scrap is what happens when time runs out.
103,286 miles
Average mileage
12 years 3 months
Average age
131,700 miles
Average mileage
17 years 3 months
Average age
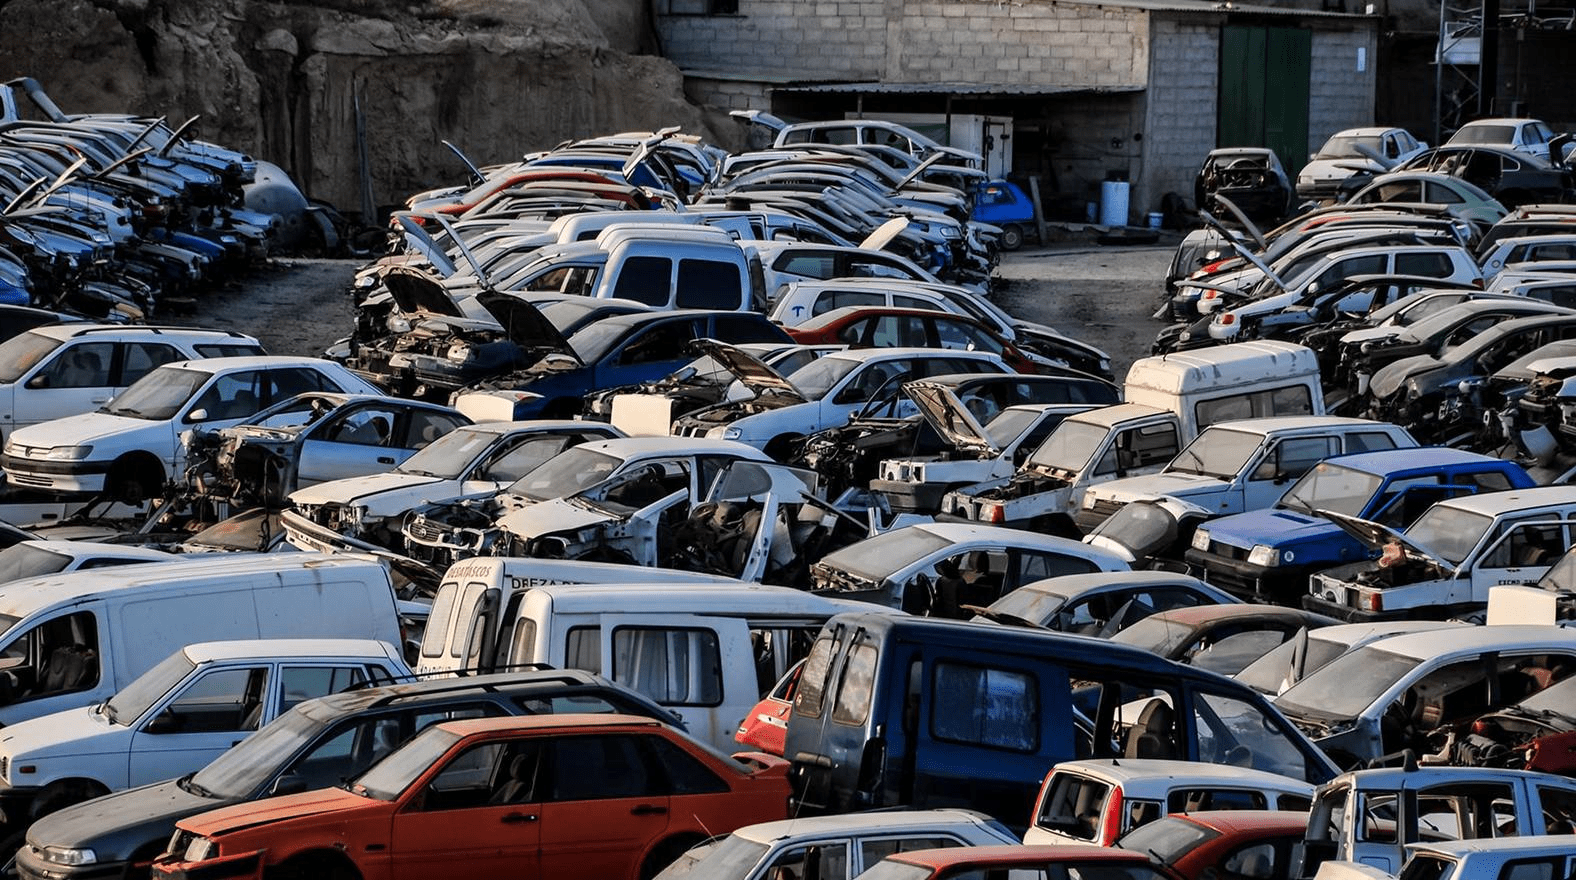
Once your vehicle is collected, it enters a strictly regulated end-of-life process handled exclusively by one of the UK's 1,951 Authorised Treatment Facilities (ATFs). Every scrapped car in the UK must legally pass through an ATF; it's a criminal offence to scrap a vehicle anywhere else.
95%
ELV Directive recovery target — minimum required by UK law per vehicle
96.3%
SYNETIQ recovery rate — one of the UK's largest vehicle recyclers
Magnet
Ferrous separation method — non-ferrous recovered via eddy current
394,587t
Total tonnage recycled (2025) — ferrous metal recovered from our dataset
The figures in this report are drawn from 461,991 scrap quotes and enquiries analysed by Car.co.uk in 2025. This dataset represents vehicles submitted for valuation through our platform and does not solely reflect confirmed scrap transactions. As the UK's largest scrap car platform by volume, our data provides a uniquely large-scale view of end-of-life vehicle characteristics, regional distribution and pricing trends, but should be read as indicative of the broader market rather than a definitive count of vehicles scrapped nationally.
Where we reference industry-wide scrappage volumes, we cite the CIWM estimate of 1.6–2 million ELVs arising annually in the UK.