Average Car Age Statistics in the UK
Learn the average age of cars across the UK, plus granular data and insights for fleets and scrap cars, breakdowns by fuel type, mileage and region, and projections for the future.
Last updated: 7th April, 2026

Anthony Sharkey is COO at New Reg Limited (Car.co.uk, Trader.co.uk, Garage.co.uk), driving innovation in vehicle recycling, logistics, and customer experience.
Listen to this story
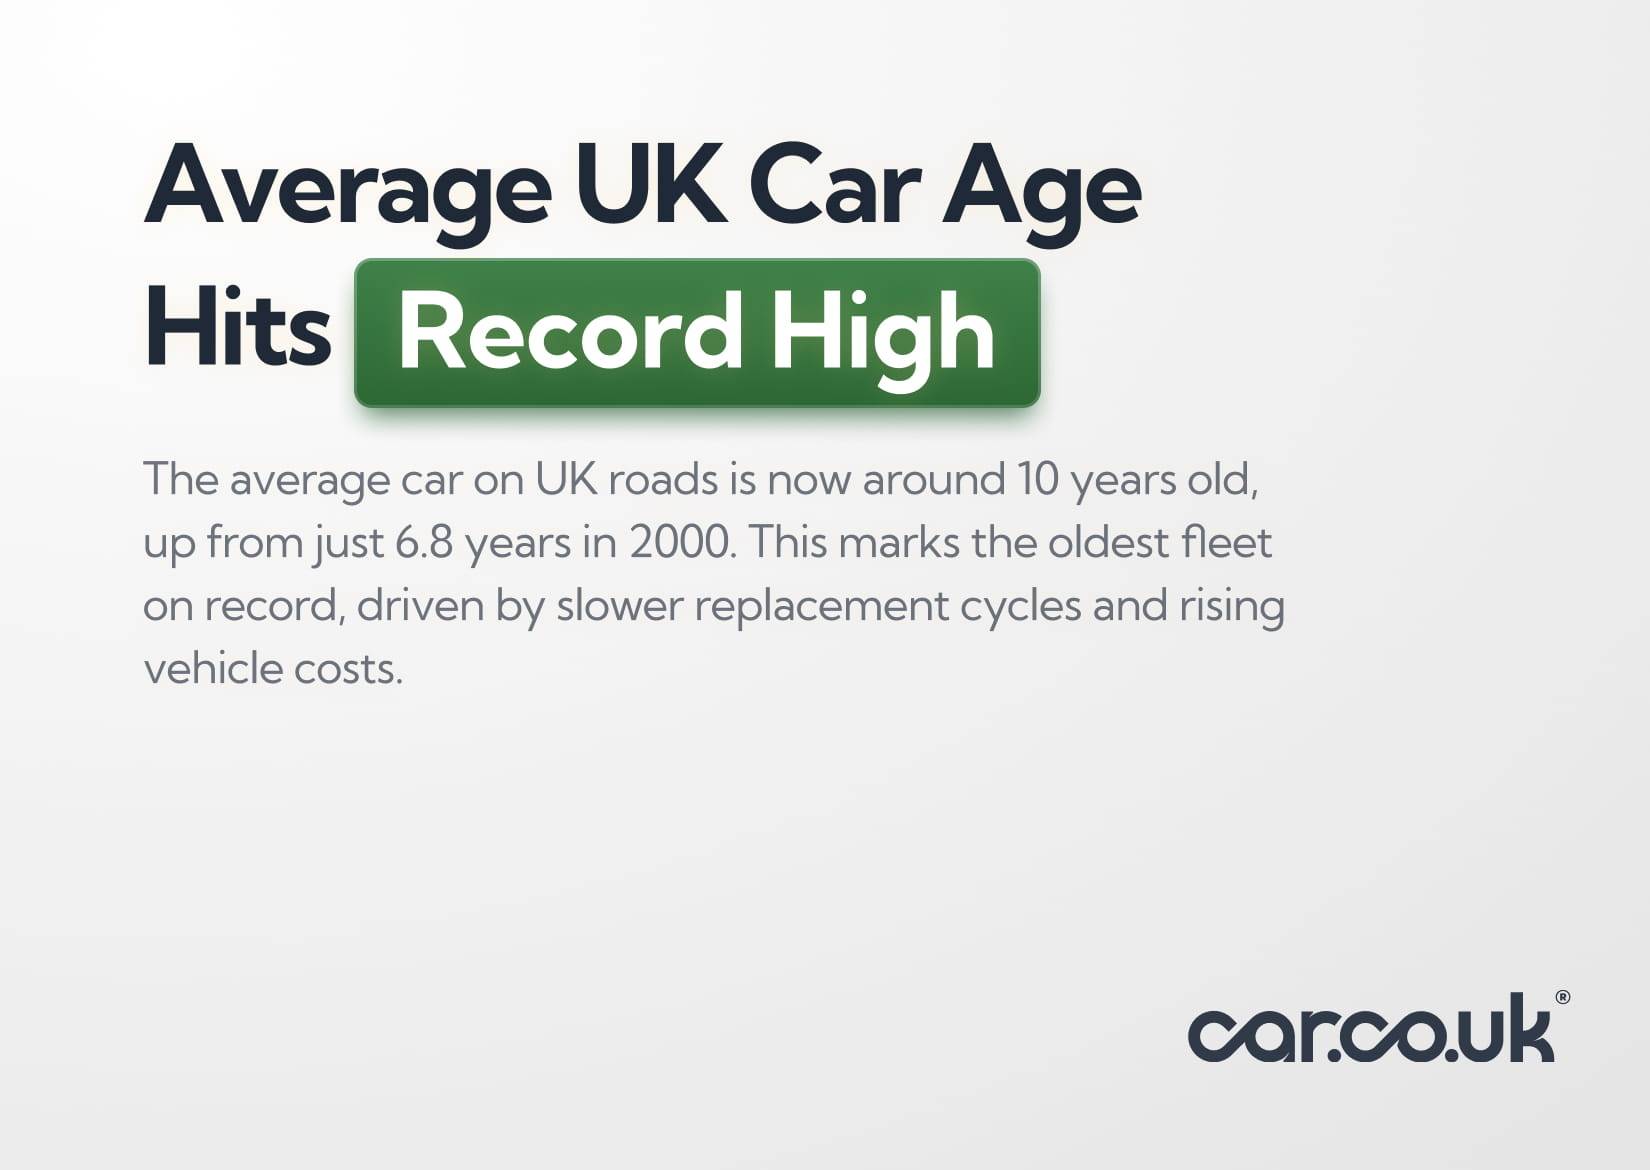
The average car on UK roads is now roughly 10 years old. That’s the oldest on record, and up from just 6.8 years in 2000.
That single figure tells a bigger story: Britain's 33.9 million licensed cars are ageing faster than they're being replaced, with more than two in five now over a decade old and the share of cars aged 13+ nearly doubling in the last ten years alone.
This article covers what's driving that figure, drawing on fleet size data, fuel-type breakdowns, annual mileage, scrappage age, regional variation and forward-looking projections to build the most complete picture of Britain's ageing car parc you’ll find on the web.
What's in this article
- 1. How Old Are Cars in the UK Today?
- 2. What is the average age of a car in the UK?
- 3. How long is a car expected to last in the UK?
- 4. How has the average car age in the UK changed over the years?
- 5. Average age of cars in the UK by fuel type
- 6. What is the average age of a scrapped car in the UK?
- 7. Average age of car parts in the UK
- 8. Average car mileage in the UK
- 9. Average car age by region: UK’s oldest and youngest car fleets
- 10. How does the UK’s average car age compare to Europe?
- 11. Most reliable older cars in the UK
- 12. Car ownership trends and driving habits
- 12.1 Who owns and uses cars in the UK:
- 12.2 How cars get used:
- 12.3 What cars mean to their owners:
- 12.4 MOT pass rates and roadworthiness of older cars
- 12.5 Future predictions and trends for the average car age in the UK
- 12.6 What does an ageing fleet mean for UK emissions? (NEW)
- 12.7 Will the electric vehicle transition lower the average car age?
How Old Are Cars in the UK Today?
Cars across the UK are getting older, with the average vehicle now approaching 10 years. Fewer new registrations and longer ownership cycles mean a growing share of the fleet is over a decade old, highlighting a clear shift in how long cars stay on the road.
What is the average age of a car in the UK?
The average age of a licensed car in the UK is 10 years, per DfT VEH1107, or 9 years and 10 months in the RAC Foundation's more granular calculation. Both figures cover every car registered with the DVLA for UK road use, whether taxed or VED-exempt.
In 2000, that average was just 6.8 years; by end-2019 it had reached 8.6 years. In other words, the fleet has aged 16% in the last five years alone, and has increased every single year since the turn of the millennium.
That unbroken upward trend is the real story. A pandemic, a chip shortage and then a cost-of-living crisis arrived almost consecutively, each suppressing new car sales and leaving existing cars on the road longer.
The result is a fleet where the average vehicle is nudging the threshold where maintenance costs and reliability risk start to climb — and where a large portion of drivers are running cars well past that point.
How many licensed cars are there in the UK?
At end-September 2025, there were 34.49 million licensed cars on the road, out of a total licensed vehicle parc of 42.4 million. As there were just 33.97 million licensed cars in the UK at end-December 2024, it’s clear we’re continuing a trend that has seen the fleet grow in all but two years since World War II (1991 and 2020).
The scale of that growth is significant: from 28.6 million vehicles in 2000 to over 40 million today, a 40.2% increase against a population that grew just 17.5% over the same period — rising from 0.48 vehicles per person to 0.57.
How long is a car expected to last in the UK?
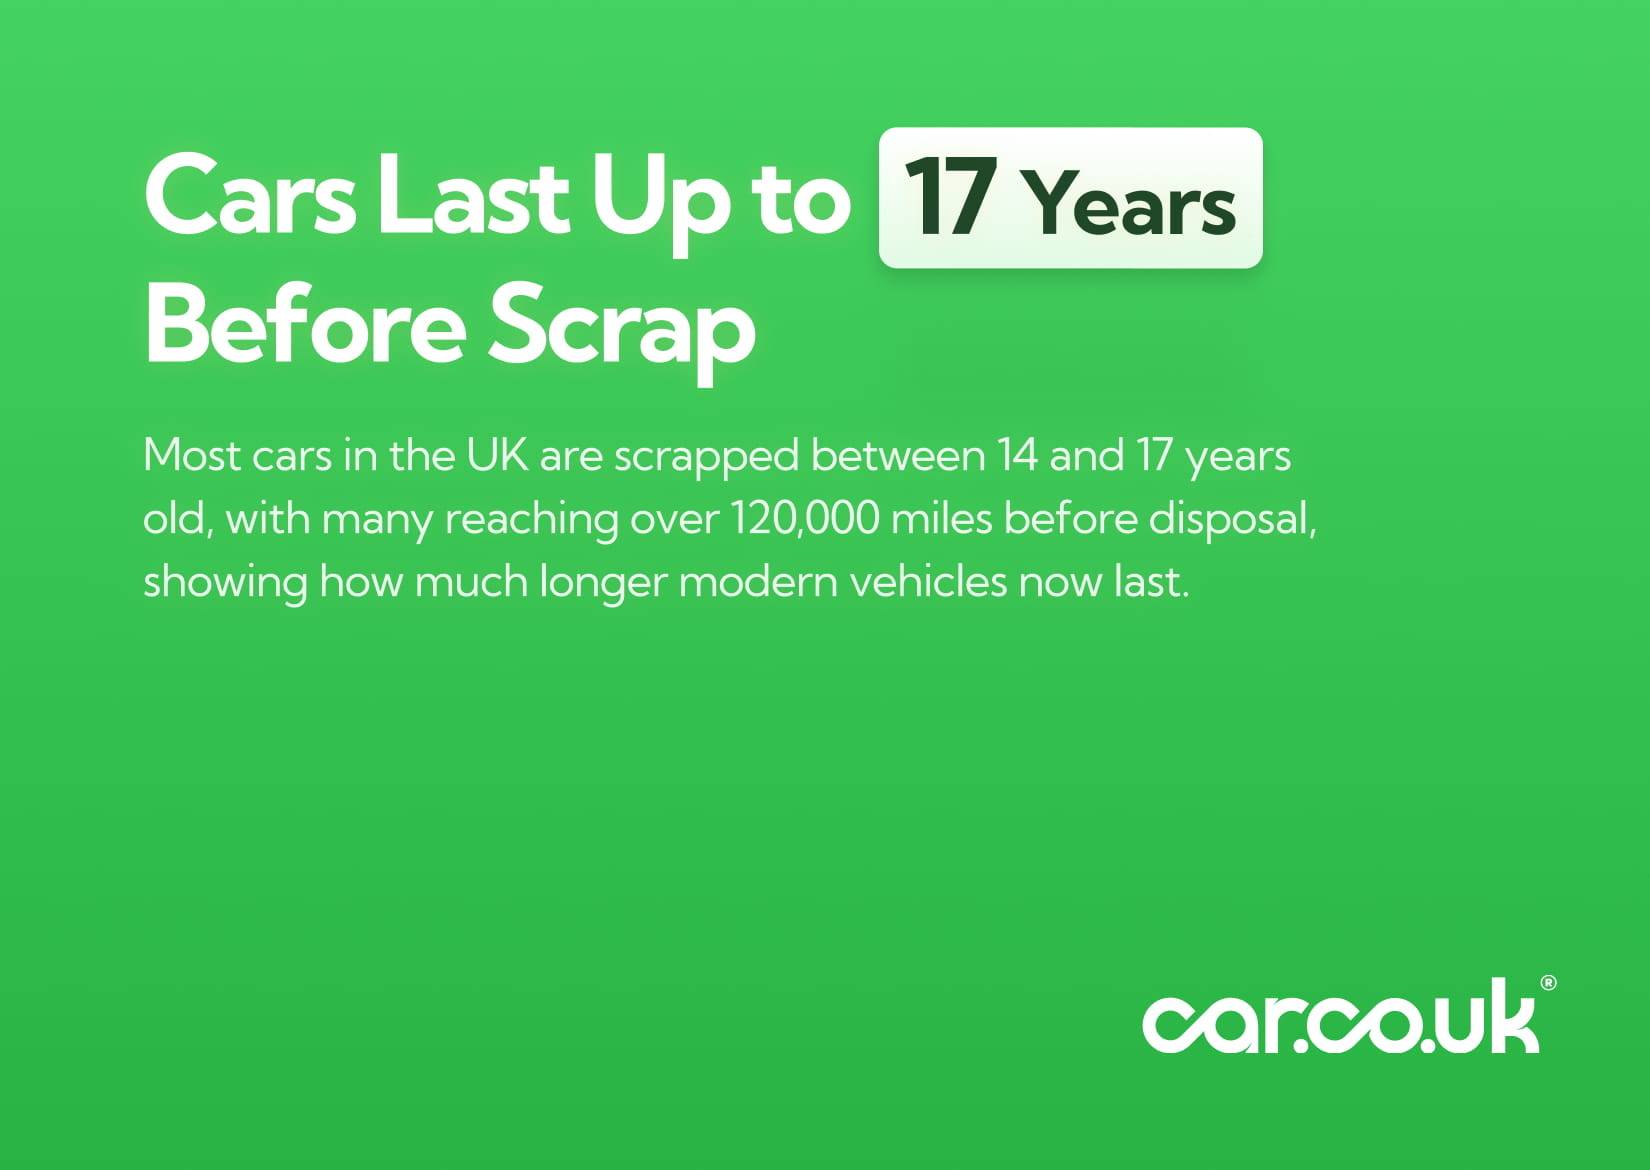
The average UK car now lasts between 14 and 17 years before being scrapped, and the data suggests that the floor is rising.
Some figures put the average scrappage age at 17 years with around 123,000 miles on the clock, while Car.co.uk's internal analysis of 500,000+ end-of-life vehicles found most scrapped cars are 16 to 20 years old with 125,000+ miles.
BMS Salvage's longer-run data anchors the average closer to 14 years, but that figure includes the 2009 government scrappage scheme, which temporarily pulled the average down to just 13 years by incentivising early retirement of vehicles that would’ve otherwise kept running.
The direction of travel is clear: cars are lasting longer because they're built better. Modern vehicles can reliably reach 200,000+ miles with proper maintenance, up from roughly 150,000 miles a generation ago.
“The days of cars rusting away before your eyes are well and truly behind us. Even a 20-year-old car with a full service history can be a good bet.” — RAC Foundation
That shift in build quality is one of the least-discussed drivers of the UK's ageing fleet. When cars simply don't wear out as fast, replacement cycles stretch and the average age of everything on the road creeps upward.
Average vehicle age by body type
Cars aren't the only vehicles ageing. Every major vehicle category on UK roads is older than it was five years ago, though the rate varies significantly by type.
Motorcycles carry the highest average age at 16 years, which reflects the fact that many are kept as leisure vehicles and maintained indefinitely rather than replaced on a fixed cycle.
HGVs sit at the opposite end at just 8 years, which makes sense: commercial operators run trucks hard and replace them on structured schedules tied to efficiency and compliance.
Cars have seen the sharpest proportional increase of any category – up 25% since 2019 – which stands out against the more modest ageing seen across vans, buses, and HGVs.
How has the average car age in the UK changed over the years?
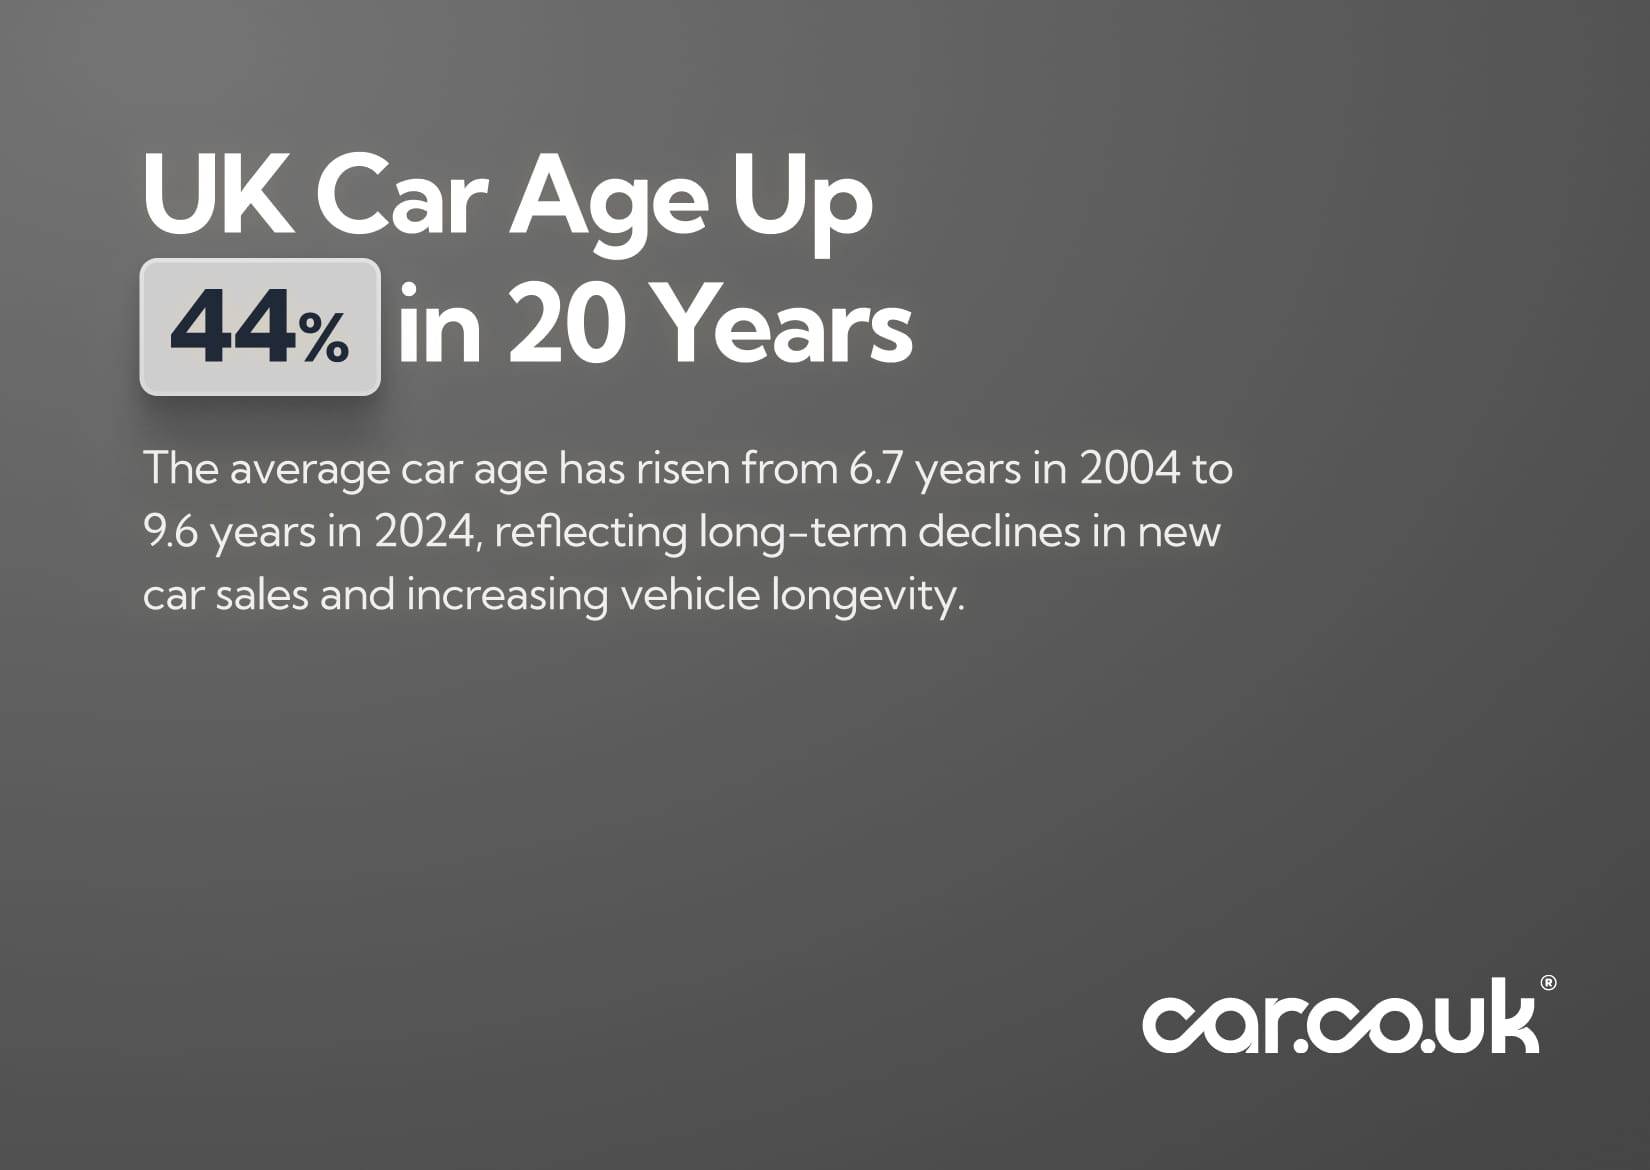
The average UK car age has increased 44% in 20 years, from 6.7 years in 2004 to 9.6 years in 2024. That didn’t happen in a straight line, though. It's a series of shocks, each one adding a year or two to the average and none of them fully unwinding before the next one hit.
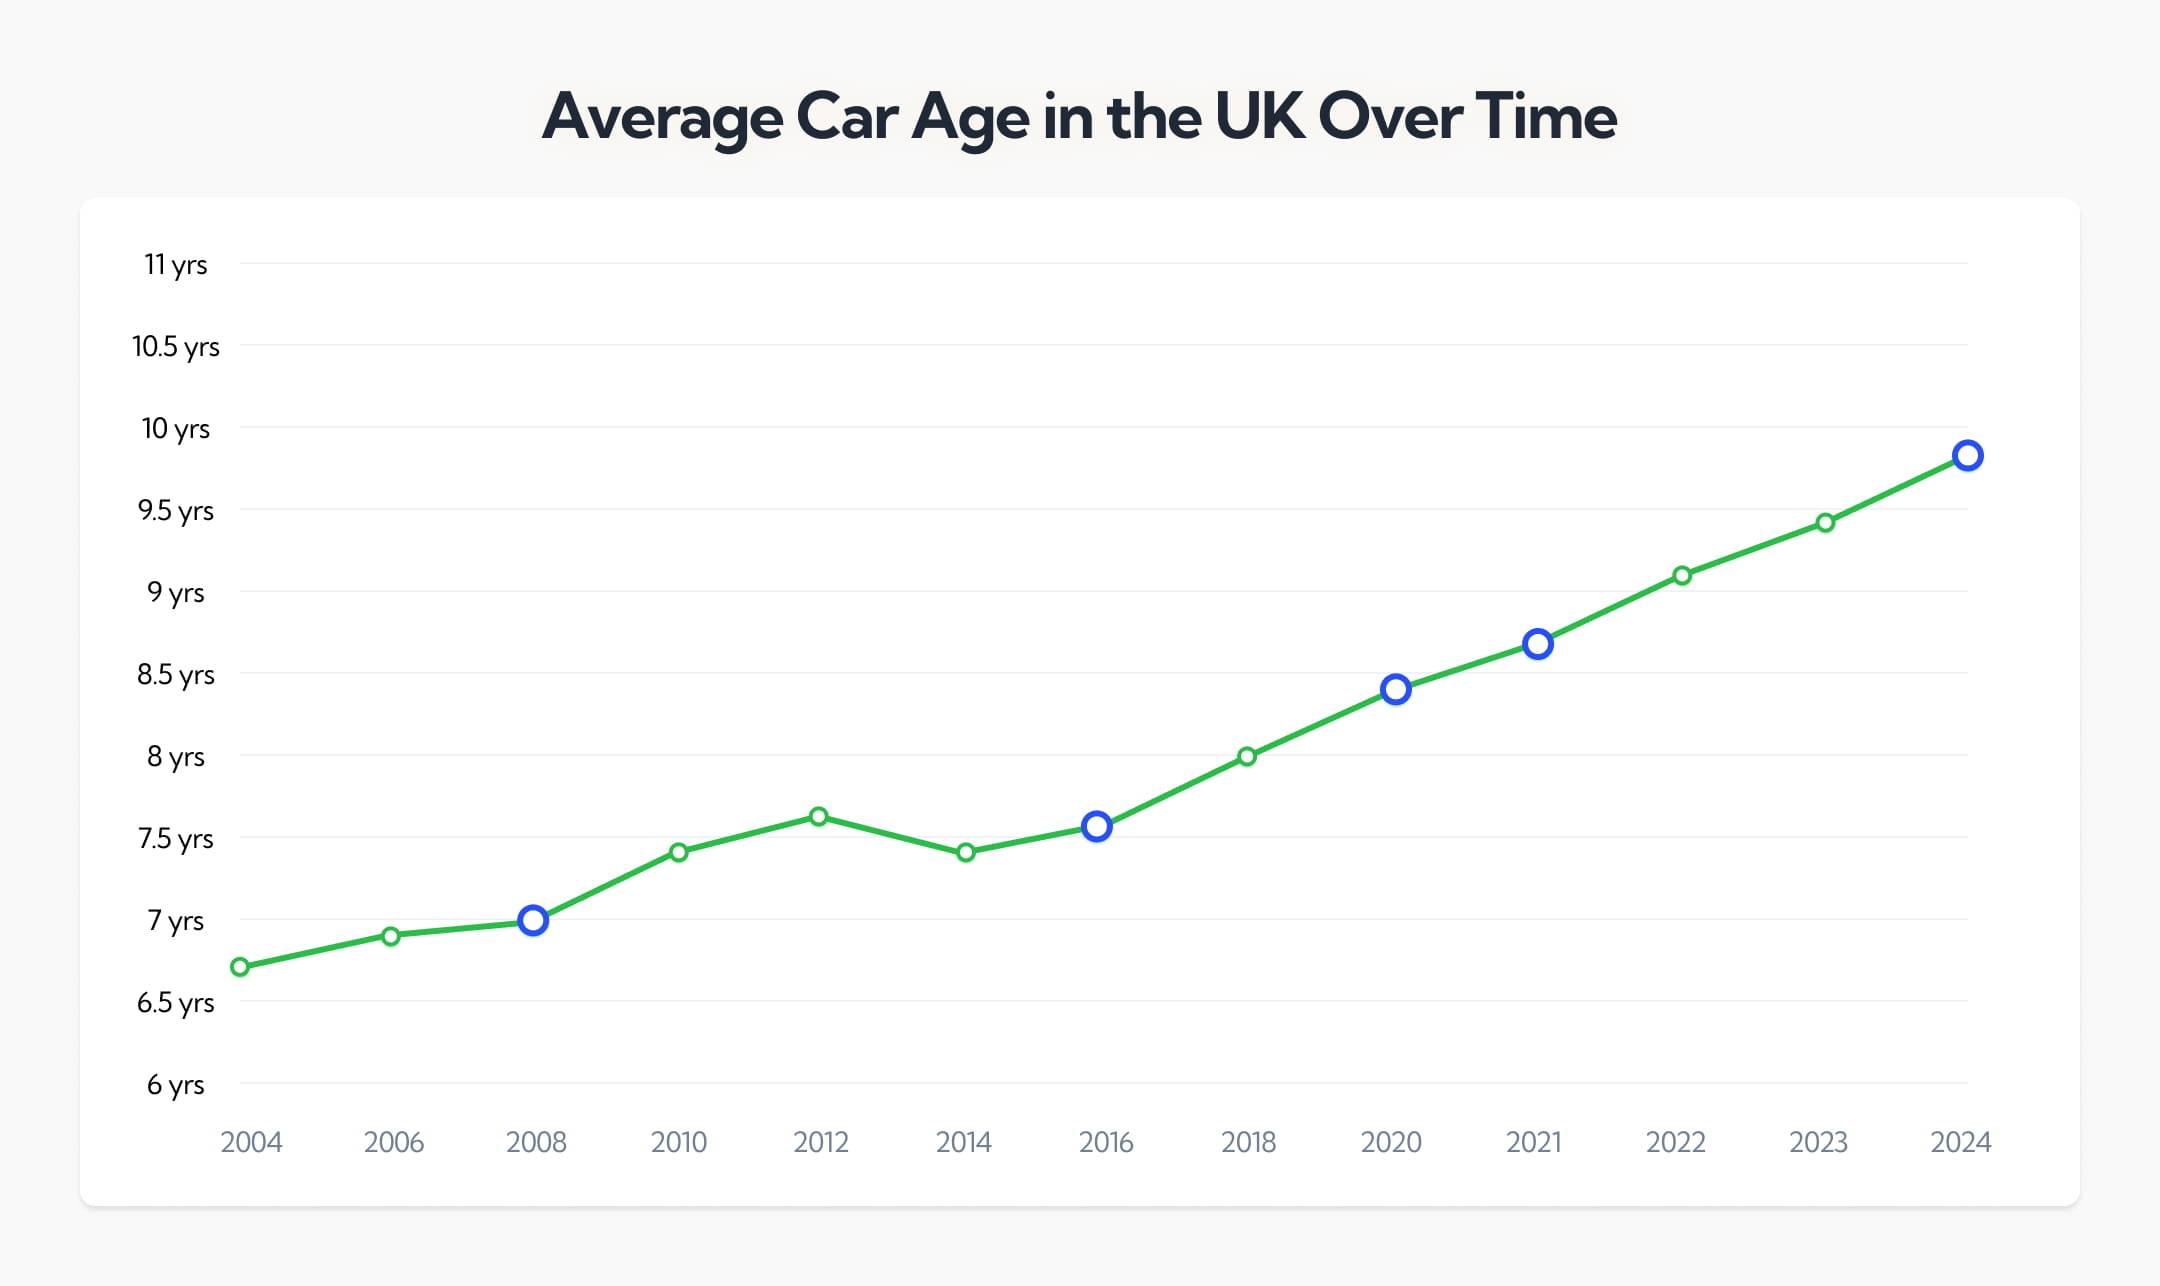
The financial crisis of 2008 was the first major inflection point. New car sales collapsed and people held onto vehicles longer, pushing average age upward from 7.0 to 7.4 years by 2010. A partial recovery followed, with 2016's record 2.69 million registrations briefly stabilising the trend.
Then came the diesel backlash, WLTP testing disruption, and a registrations slump — all before COVID shut showrooms entirely in 2020. By that point, almost 10 million cars on UK roads had been in service since 2008 or earlier, and the average car was built in 2011.
The chip shortage of 2021–2023 then removed new supply precisely when demand was recovering, compressing the fleet's ability to renew itself. The result is that 8.2 million cars over 13 years old are now on UK roads, which is nearly double the share (24.4%) compared to what it was a decade ago (15.3%).
Key drivers behind the UK’s ageing car fleet
The most direct driver behind the UK’s ageing car fleet is affordability: average new car transaction prices now exceed £30,000, which prices out a significant portion of would-be buyers.
But several forces have converged:
- Average new car prices now exceed £30,000.
- Sales have never fully recovered from the Covid collapse: 2.69m in 2016, down to 1.61m in 2022, back to just 1.95m in 2024.
- The 2021-23 chip shortage removed supply from the market for months at a time.
- Working from home means fewer commuting miles and an easier case for keeping what you have.
- Modern cars hold up well enough that age alone is no longer a reliable prompt to replace.
- Mixed government messaging on the 2030 petrol/diesel ban leads buyers to sit on their hands until the picture clears.
Each factor alone would slow fleet renewal. Together, they explain why average car age has risen every single year since 2000 (and why there's no obvious reversal on the horizon).
What the experts say

Steven Jackson OBE

Average age of cars in the UK by fuel type
The average age of a UK car looks very different depending on what's under the bonnet. Petrol and diesel vehicles reflect decades of dominance and slow turnover, while EVs and hybrids skew young simply because mass adoption is recent. In fact, the gap between petrol/diesel and BEV fuel types is over 7 years.
The following sections break down each fuel type in detail.
What is the average age of petrol cars in the UK?
Petrol cars are the oldest vehicles on UK roads by fuel type, averaging 10 years and 4 months at the end of 2024. They’re fractionally ahead of diesel and well above the overall fleet average of 9 years 10 months.
This gap reflects petrol's long-standing dominance: 59% of all cars in England are still petrol-powered, meaning a huge volume of older vehicles are simply staying in circulation.
Those cars are also being used less intensively than any other fuel type, averaging just 6,200 miles per year – the lowest of any category – which slows wear and reduces the pressure to replace.
New petrol registrations meanwhile fell 17% in 2024 to 749,000, down from 899,000 the year before, meaning the incoming cohort is shrinking while the existing stock ages in place.
How long do diesel cars last in the UK?
Diesel cars currently average 10 years and 1 month in the UK, which is just three months younger than their petrol counterparts and well above the overall fleet average.
Diesels make up 30% of cars in England, but that share is shrinking: new diesel registrations have been falling since peaking around 2016, when the Volkswagen emissions scandal fundamentally reframed public and political attitudes toward the fuel type. Diesel volumes in the motorparc fell 2.3% in 2020 alone, and the trajectory hasn't reversed since.
What's kept older diesels on the road is their utility. They averaged 8,300 miles per year in 2024, so they're still being driven harder than any other fuel type, even if that's down from 9,400 miles in 2019.
But age is increasingly a liability for diesel owners specifically: Euro 6 compliance – which broadly means post-2015 registration – is the threshold for most Clean Air Zones and ULEZ schemes. Older diesels face daily charges that petrol equivalents simply don't, so there’s a lot of financial pressure to scrap or replace them, which doesn't apply evenly across other types.
What is the average age of electric cars in the UK?
The average BEV on UK roads is just 2 years and 6 months old, which is pretty much exactly when mass EV adoption started.
In other words, the fleet is young because it's new, not because older EVs are disappearing. In 2020 there were 199,085 electric cars in the UK (0.6% of the fleet). By the end of 2024 that had reached 1.29 million (3.8%), with 382,000 new zero-emission cars registered in 2024 alone (19% of all new registrations!).
What's notable is how those cars are being used: BEVs under three years old averaged 10,054 miles in 2024, within 6% of equivalent diesels at 10,728 miles. But 82% of new zero-emission registrations went to company keepers, which tells us that the private market is still catching up.
How old are hybrid cars in the UK on average?
Plug-in hybrids average 3 years and 4 months, which is older than BEVs but still a very young fleet compared to the overall average (and certainly compared to diesels and petrols).
This demonstrates a meaningful but more gradual adoption curve compared to pure electric. In 2024, 6% of cars in England were hybrid and 2% were PHEV, and combined with BEVs, electrified vehicles still only represent around 1 in 20 cars on the road.
Additionally, HEV numbers grew by a fifth to 621,622 in the 2020 motorparc alone, pointing to how quickly the category scaled from a niche to a mainstream option. And they get heavy use; PHEVs under three years old averaged 9,367 miles in 2024. That puts to bed any notion of hybrids as low-mileage compliance cars.
Petrol vs diesel vs electric: fleet age comparison
The headline takeaway from all this is that petrol and diesel cars are a decade old on average and being driven less each year, while the average BEV is under three years old and being driven more than either.
In 2020, 97.1% of the entire UK car parc – that’s 34 million vehicles – was petrol or diesel. That cohort is now ageing in place, and the pace of electrification isn't yet fast enough to pull the overall average down.
What is the average age of a scrapped car in the UK?
The average scrapped car in the UK is between 14 and 17 years old at the point of disposal, but that figure masks a wide range:
- Scrap Car Comparison's 2024 data puts the average at 17 years with around 123,000 miles on the clock.
- Our own internal analysis of 500,000+ end-of-life vehicles found most fall in the 16-20 year bracket with 125,000+ miles.
- BMS Salvage's longer-run average sits closer to 14 years, partly because policy interventions like the 2009 scrappage scheme brought cars to ATFs several years ahead of schedule.
With the fleet average now at 9 years 10 months, the gap between a typical car on the road and one heading for an ATF is just 4-7 years (and closing). Of the 20.4 million vehicles aged 10+ years, around 1.5 million are scrapped annually across 1,951 ATFs. ULEZ and Clean Air Zone charges are pushing that timeline forward for older diesel owners in particular.
Most commonly scrapped car models in the UK
According to our internal vehicle scrappage data, the most scrapped cars models in the UK are consistently the:
- Ford Fiesta
- Vauxhall Corsa
- Volkswagen Golf
- Ford Focus
- Vauxhall Astra
No surprise, given they dominated sales charts 14-17 years ago. The pattern is predictable enough to be almost mechanical: whatever topped registrations in a given year will likely top the scrappage charts roughly 15 years later.
The exception is cars under 10 years old, where write-offs from accident damage, rather than age, is the primary cause of scrappage decisions.


What is the average age of a first car in the UK?
Insurance industry data tells us that the typical first car in the UK is 7 to 10 years old at the point of purchase. Like many of the other car age trends we’ve covered, this is a direct consequence of affordability, not preference.
Two costs price younger buyers toward the used market by default:
- A new car now averages >£30,000.
- Insurance for a 20-year-old runs around £850/year, versus £639 for a driver in their 30s.
The result is a predictable shortlist. The Ford Fiesta, Vauxhall Corsa, VW Golf, Ford Focus and Vauxhall Astra dominate first-car purchases for the same reasons they dominate scrappage: abundant supply, reasonable running costs and cheap parts.
When the DfT surveyed buyers on priorities, reliability topped the list at 71%, with cost just behind at 70%. Both factors point squarely at a well-maintained used car over anything new.
Average age of car parts in the UK
A car's age tells only part of the story. Its components age at different rates from one another. Your battery, tyres, engine, clutch and gearbox each follow their own replacement cycle depending on their mileage, your driving style and the car’s maintenance history.
With the average UK car now approaching 10 years old, most vehicles will have already cycled through at least some of these before they reach the scrap yard.
What is the average age of a car battery in the UK?
A standard lead-acid car battery typically lasts 3 to 5 years in the UK, often toward the lower end of that range. Cold winters and short urban trips, which are both common in the UK, prevent batteries from fully charging and accelerate degradation. So for most UK drivers, a battery replacement is a near-certainty before the 5-year mark.
EV and hybrid high-voltage batteries are a different proposition entirely. Most manufacturers warrant them for 8 years or 100,000 miles, but real-world data is starting to paint a more optimistic picture.
A February 2026 study by Generational of 8,000+ EVs across 36 brands found average battery State of Health at 95.15%, with even 8-9 year old vehicles retaining around 85% capacity. EV tech is still young enough that long-run degradation remains genuinely unknown, but early signs suggest EV batteries may outlast the cars themselves.
How long do car tyres last in the UK?
In the UK, tyres typically last 20,000 to 30,000 miles or 3 to 5 years under normal driving conditions. With the average driver covering just 7,100 miles a year, most will get 3 to 4 years from a set before hitting the legal minimum tread depth of 1.6mm, though driving style, road conditions and tyre quality all affect that considerably.
What is the average lifespan of a car engine in the UK?
Modern petrol engines are built to last 150,000 to 200,000+ miles with proper maintenance, while diesel engines – with their heavier construction and lower revving – regularly exceed 200,000 to 300,000 miles.
Electric motors are in a different category altogether. With far fewer moving parts and no oil, coolant or combustion stress, most are projected to exceed 500,000 miles.
For context, at the UK's average annual mileage of 7,100 miles, even a petrol engine could theoretically last 28 years before hitting its ceiling. As long as you drive and maintain it properly, your engine should last longer than most owners will keep the car.
How long can you expect a car clutch to last in the UK?
Manual clutches typically last 60,000 to 100,000 miles, but driving style is the dominant variable. Motorway driving barely touches the clutch, while urban stop-start traffic can halve its lifespan.
That matters in the UK context specifically; 61% of cars in England are still manual, meaning the majority of drivers are working a clutch daily. At 7,100 miles per year, a well-driven car could make it 14 years before needing a clutch replacement, but a city commuter might be replacing theirs in under a decade.
What is the typical lifespan of a car gearbox in the UK?
Gearbox lifespan varies significantly by transmission type:
- Manual: 100,000 to 150,000+ miles with normal use.
Automatic: Needs fluid servicing around 60,000 to 80,000 miles but can reach 150,000 to 200,000+ miles with proper maintenance.
Cambelt: Not a gearbox component, but worth flagging here; replacement is due around 60,000 miles and failure can destroy the engine entirely.
Manual gearboxes outlast automatics in most cases. But car gearbox failure in automatics is more common and more costly, and they’re typically the result of neglected fluid changes rather than mechanical wear.
Average car mileage in the UK
Annual mileage shapes how quickly a car ages in practice. A 10-year-old car covering 5,000 miles a year is a very different vehicle to one that's done 15,000.
The sections below cover national averages, trends over time and how mileage varies by fuel type, gender, and driving purpose.
What is the average annual mileage of a car in the UK?
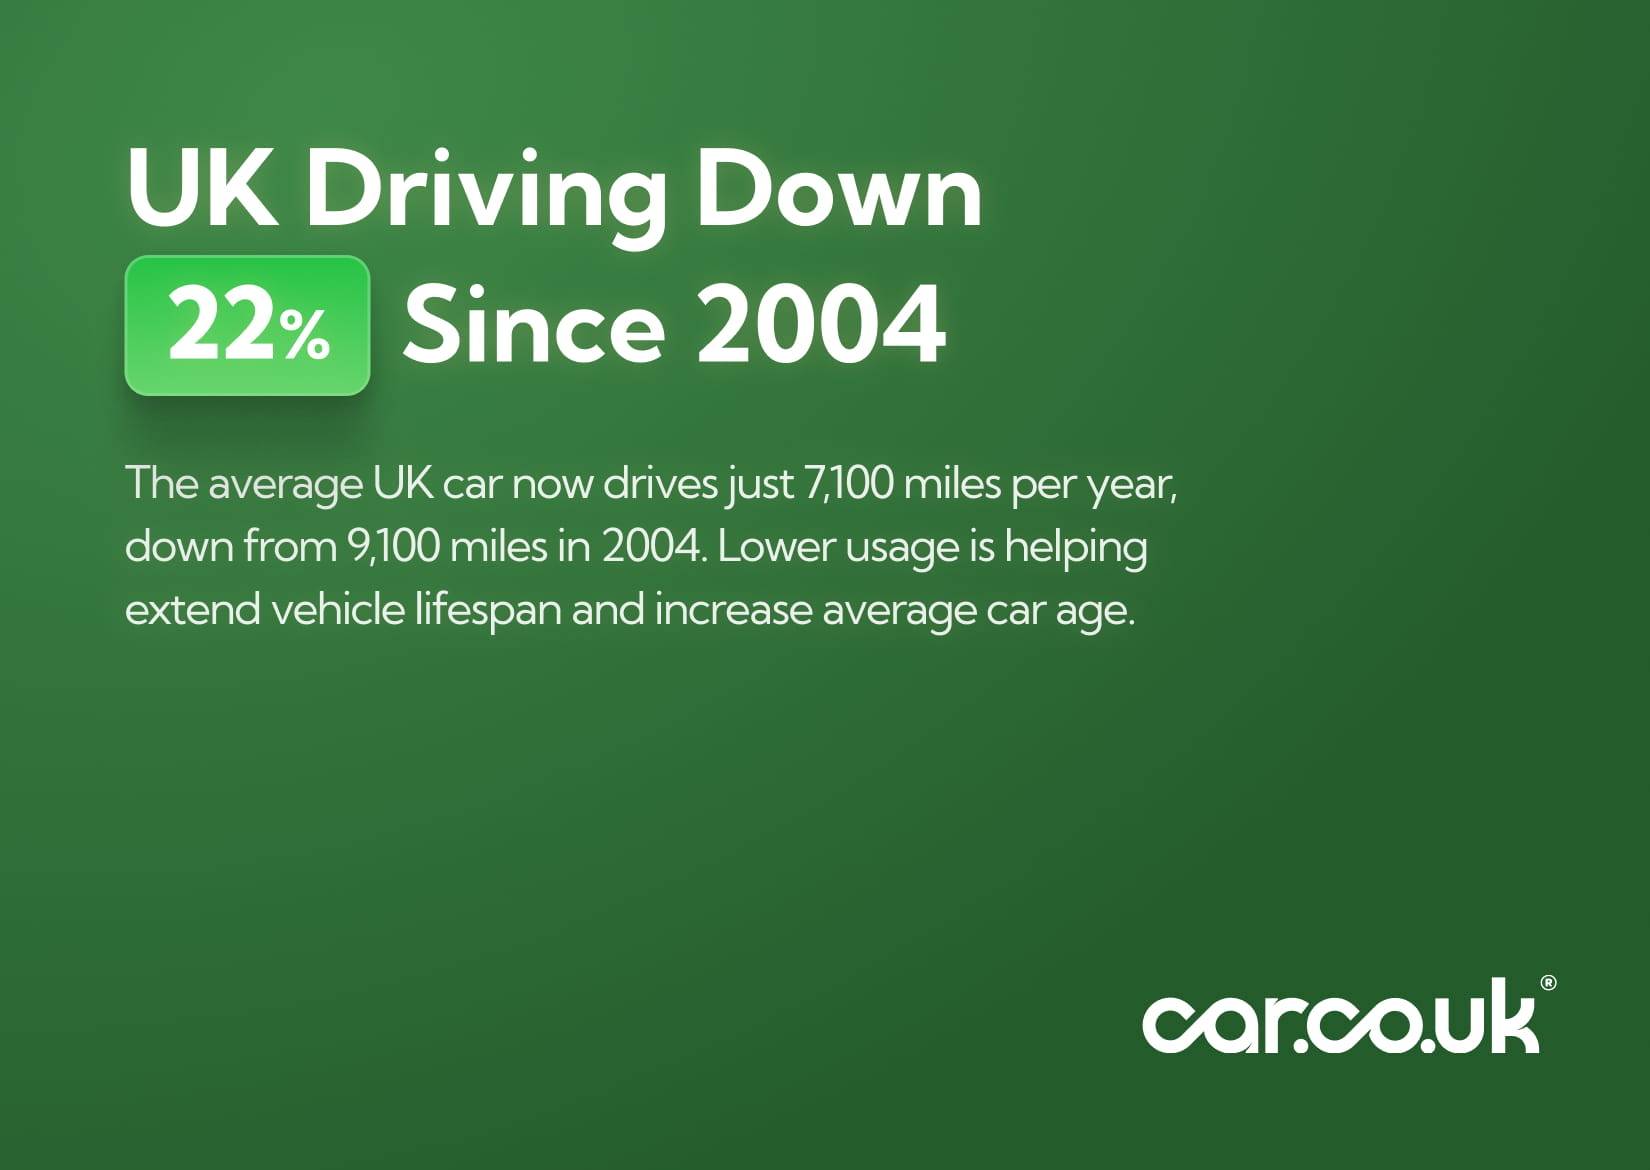
According to the 2024 National Travel Survey published by the Department for Transport, the average UK car covered 7,100 miles in 2024. This is down 22% from 9,100 miles in 2004.
The decline breaks down by trip purpose:
- Business mileage: Down 64%, from 1,100 miles/year in 2004 to just 400 in 2024.
- Commuting mileage: Down from ~2,700 pre-pandemic to 2,200 to 2,300 today.
- Average journey length: 8.1 miles.
Total GB road miles reached 336.2 billion in 2024, which is up 1.6% YoY but still 0.7% below 2019. So there are more cars on the road, being driven less. Lower mileage means slower wear and less need to replace, which, again, is a direct contributor to the UK's rising average car age.
Average mileage by fuel type
Mileage varies significantly by fuel type, and the EV picture in particular has shifted dramatically over the last decade.
Diesel drivers still cover 34% more miles per year than petrol on average, but the more telling shift is in EVs.
Ten years ago, a new BEV covered just 49% of the miles of a comparable diesel. But 2024 data from the RAC Foundation shows that the 2024 figure was 94%. The gap has closed almost entirely, and the idea that electric cars are low-mileage vehicles has been put to rest.
Average car mileage by gender
Male drivers cover more miles per year despite taking fewer trips, meaning they have longer average journey lengths. Female drivers make more trips but cover less distance overall.
Average car age by region: UK’s oldest and youngest car fleets
Car age isn't evenly distributed across the UK. Eastern and Southern England consistently carry the oldest fleets, with Norwich topping the table at 11.96 years, which is nearly two full years above the national average.
Northern cities tend to skew younger due to a combination of different financing patterns, higher turnover in urban centres or stronger fleet activity in those markets.
UK cities with the oldest average car age
Car dependency also varies by nation: 67% of Welsh commuters drive to work versus 66% in England and 70% in Scotland. Scotland's higher car reliance may be partly tied to rural geography and limited public transport alternatives.
How does the UK’s average car age compare to Europe?
At around 10 years, the UK fleet is actually younger than the European average , which hit 12.3 years in 2024 (up from 8.4 years in 2007). The UK ranks 8th-newest in Europe, sitting well below the continental average but some way behind the youngest fleets.
Average car age across Europe
One outlier worth flagging beyond Lithuania: despite having a comparatively young fleet, UK drivers average just 7,897 miles per year, which is the lowest of 18 European countries analysed, against an EU average of 11,362 miles. Britain has newer cars than most of Europe but uses them less than almost anyone.
Most reliable older cars in the UK
According to the Warrantywise Reliability Index – one of the most cited sources for used car dependability in the UK – the Toyota Yaris tops the rankings for cars aged 8-12 years with a score of 93.6/100, followed closely by the Honda Civic at 93.0/100.
Both are unsurprising entries. Japanese manufacturers have consistently led reliability tables for decades, and these models in particular have a strong reputation for low-cost maintenance and longevity.
You’ll find the full top-10 list below:
Now, what about the most reliable older car of all time? At the extreme end of vehicle longevity sits the Morris Minor, first produced in 1948 with 3,390 still registered on UK roads today. It's a niche data point, but it illustrates something real: a well-built car, properly maintained, can outlast almost any reasonable expectation of lifespan.
Car ownership trends and driving habits
NTS 2024 and DfT evidence show that cars are deeply embedded in UK daily life. 78% of households have at least one car or van and 34% have two or more.
But the trends they’ve reported go far deeper…
Who owns and uses cars in the UK:
- 40% of households in the lowest income quintile have no car access, versus 14% in the highest.
- 61% of new cars in 2024 went to business and fleet buyers; only 9.3% of the total fleet is company-kept.
- 75% of English residents aged 17+ hold a full driving licence – 81% of men and 71% of women.
- Black is now the UK's most popular car colour, with 7.1 million registered (up from 5.0 million in 2010).
How cars get used:
- Leisure is the most common trip purpose at 33%, ahead of shopping (19%) and commuting (13%).
- The average car journey is 8.1 miles.
- Cars are in motion just 4% of the time.
- The proportion of cars parked in garages overnight has fallen from 22% in 2002 to just 9% today.
What cars mean to their owners:
- 83% of people used a private car at least once a week in 2024.
- 77% say losing their car would affect their ability to visit family and friends.
- 26% say it would force them to change jobs.
MOT pass rates and roadworthiness of older cars
Every private car in the UK must undergo annual MOT testing from three years old. That makes the DVSA's MOT dataset one of the most useful real-world windows into fleet condition.
According to data we’ve compiled these are the headline figures:
- National MOT pass rate: ~73.7% (but this masks huge variation)
- Best-performing vehicle cohorts: 90%+ pass rate
- Worst-performing cohorts: <55%
- 20-year-old cars: Highest fail rate of any age group at 37.36%
- EVs and hybrids: Only 15% fail rate
- Overall failure rate: Down from 2.54% in 2020 to 1.73% in 2023, ticking up slightly in 2024
For older cars, roadworthiness increasingly intersects with emissions compliance. Pre-Euro 4 petrol (pre-2006) and pre-Euro 6 diesel (pre-2015) vehicles face daily charges of up to £12.50 in London's ULEZ and Clean Air Zones, which effectively puts a ceiling on how long it makes sense to keep an older car in an urban area.
Future predictions and trends for the average car age in the UK
The short-term outlook is straightforward: the UK's average car age is going to keep rising. Cost-of-living pressures haven't eased, new car prices haven't fallen and the EV transition isn't moving fast enough yet to pull the fleet average down.
The medium-term picture hinges on EV adoption. The ZEV mandate requires 80% of new car sales to be zero-emission by 2030, and that raises to 100% by 2035. Per RAC Foundation data, there were 1.39 million ZEVs licensed at the end-2024 against a target of ~13 million by 2030. So, that would be a near-tenfold increase in six years from a base of under 4% of the fleet. If it materialises, average age could start falling from the late 2020s. If instead charging infrastructure, affordability and policy uncertainty slow adoption, the fleet keeps ageing.
Longer term, the scale of demand growth makes the transition non-negotiable. DfT projects road traffic to grow anywhere from 8-54% by 2060, with van traffic already up 82% in 25 years and now accounting for 23% of all motor vehicle miles. More vehicles travelling more miles on an ageing infrastructure… The pressure to accelerate fleet renewal will only intensify.
What does an ageing fleet mean for UK emissions? (NEW)
In a lot of ways, the UK's emissions problem and its ageing fleet problem are the same problem. Newer cars are meaningfully cleaner – SMMT reports that a car built in 2020 produces nearly a fifth less CO2 per kilometre than one built nine years earlier. When the average vehicle on the road is approaching a decade old, that efficiency gap compounds across 34 million cars and billions of miles driven annually.
The numbers make the scale of the challenge hard to ignore. As established above, EVs currently account for less than 4 in every 100 cars on UK roads. Getting to net zero requires something closer to 38 in every 100 by 2030. That delta doesn't close through policy announcements; it closes through physical fleet turnover, which takes years and depends on affordability, infrastructure and consumer confidence all moving in the right direction at once.
Until they do, an ageing ICE fleet remains the dominant reality, and the emissions trajectory will reflect that.
Will the electric vehicle transition lower the average car age?
Eventually, yes, but not soon. If EV adoption hits mandated levels, a sustained wave of new registrations from the late 2020s onward would start pulling the fleet average down.
The problem is what's already on the road: ICE cars built today will still be running in the 2040s, and the ones built a decade ago are only halfway through their lifespan, statistically. Full fleet transition is a 20-year process at minimum.
The used EV market offers a more immediate shift. As company fleet BEVs age out and enter the second-hand market, budget buyers gain access to lower-emission vehicles for the first time, which broadens EV ownership beyond the new-car demographic that has dominated uptake so far. That's where average age and emissions improvements will start to show up in the data for ordinary drivers.
The honest answer is that average car age will likely get worse before it gets better, peaking sometime in the late 2020s before fleet renewal begins to take hold.
About Car.co.uk

Share on
Latest news & blogs