Road Accident Statistics in the UK
This page covers UK road accident statistics, including fatality and injury rates, the most common causes of accidents and how different road users are affected in 2026.
Last updated: 8th April, 2026

Award-winning CEO driving growth and social impact across automotive, recycling, and technology-led enterprise platforms.
Listen to this story
In 2024, 1,671 people were killed on UK roads. A further 28,804 were seriously injured. These figures come from official data collected across England, Scotland, Wales and Northern Ireland, and they're the most complete picture we have of road danger in the UK.
Great Britain's data is gathered through STATS19, the reporting system used by all police forces when they attend an injury collision. Northern Ireland publishes its own equivalent through the PSNI.
Neither dataset captures every incident – there's no legal requirement to report all collisions – but together they form the authoritative basis for road safety policy, infrastructure investment and enforcement decisions across the country.
In this article, you’ll find the most comprehensive compilation of road accident statistics in the UK.
What's in this article
- 1. UK Road Accident Statistics Overview
- 2. How many road accidents happen in the UK each year? (2014-2024)
- 3. How many people die in car accidents in the UK each year?
- 4. Road accident statistics by age and gender
- 5. What are the most common causes of car accidents in the UK?
- 5.1 How many car accidents are caused by drink driving in the UK?
- 5.2 What percentage of car accidents in the UK are caused by excessive speeding?
- 5.3 How often does distracted driving lead to car accidents in the UK?
- 5.4 What percentage of UK car accidents are caused by inexperienced drivers?
- 5.5 What impact do dangerous road conditions have on car accidents?
- 5.6 How many car accidents in the UK are caused by tailgating?
- 5.7 Seatbelt use and car accident fatalities
- 5.8 How many fatal road traffic accidents happen in the UK each year?
- 6. Car accident statistics by road type in the UK
- 7. UK car accident statistics by region
- 8. UK car accident statistics by time of day, week and month
- 9. UK car accident statistics by season
- 10. Car accident injury statistics in the UK
- 11. Vulnerable road user accident statistics in the UK
- 11.1 Motorcycle accident statistics in the UK
- 11.2 Pedestrian accident statistics in the UK
- 11.3 Cycling accident statistics in the UK
- 11.4 E-scooter accident statistics in the UK
- 11.5 What to do after a car accident in the UK
- 11.6 What should you do immediately after a car accident?
- 11.7 What to do after a minor car accident in the UK
- 11.8 When should you report a car accident to the police?
- 11.9 How to report a car accident to your insurance company
- 12. Car accident compensation and claims statistics in the UK
- 13. UK road safety statistics and trends
- 13.1 How have UK road safety statistics changed over the years?
- 13.2 What impact have speed limits had on UK car accident rates?
- 13.3 How has drink driving legislation affected UK road safety?
- 13.4 What role has vehicle safety technology played in reducing car accidents?
- 13.5 UK vs international road safety comparison
- 14. Future predictions for road accident statistics in the UK
- 15. How road accident data is collected in the UK
- 16. The economic cost of road accidents in the UK
- 17. Safety tips to prevent car accidents in the UK
UK Road Accident Statistics Overview
Understanding the scale and impact of road accidents across the UK starts with the key numbers. The data below highlights fatalities, serious injuries, overall casualties, and wider trends in road safety, giving a clear snapshot of how UK roads are performing and where risks remain.
How many road accidents happen in the UK each year? (2014-2024)
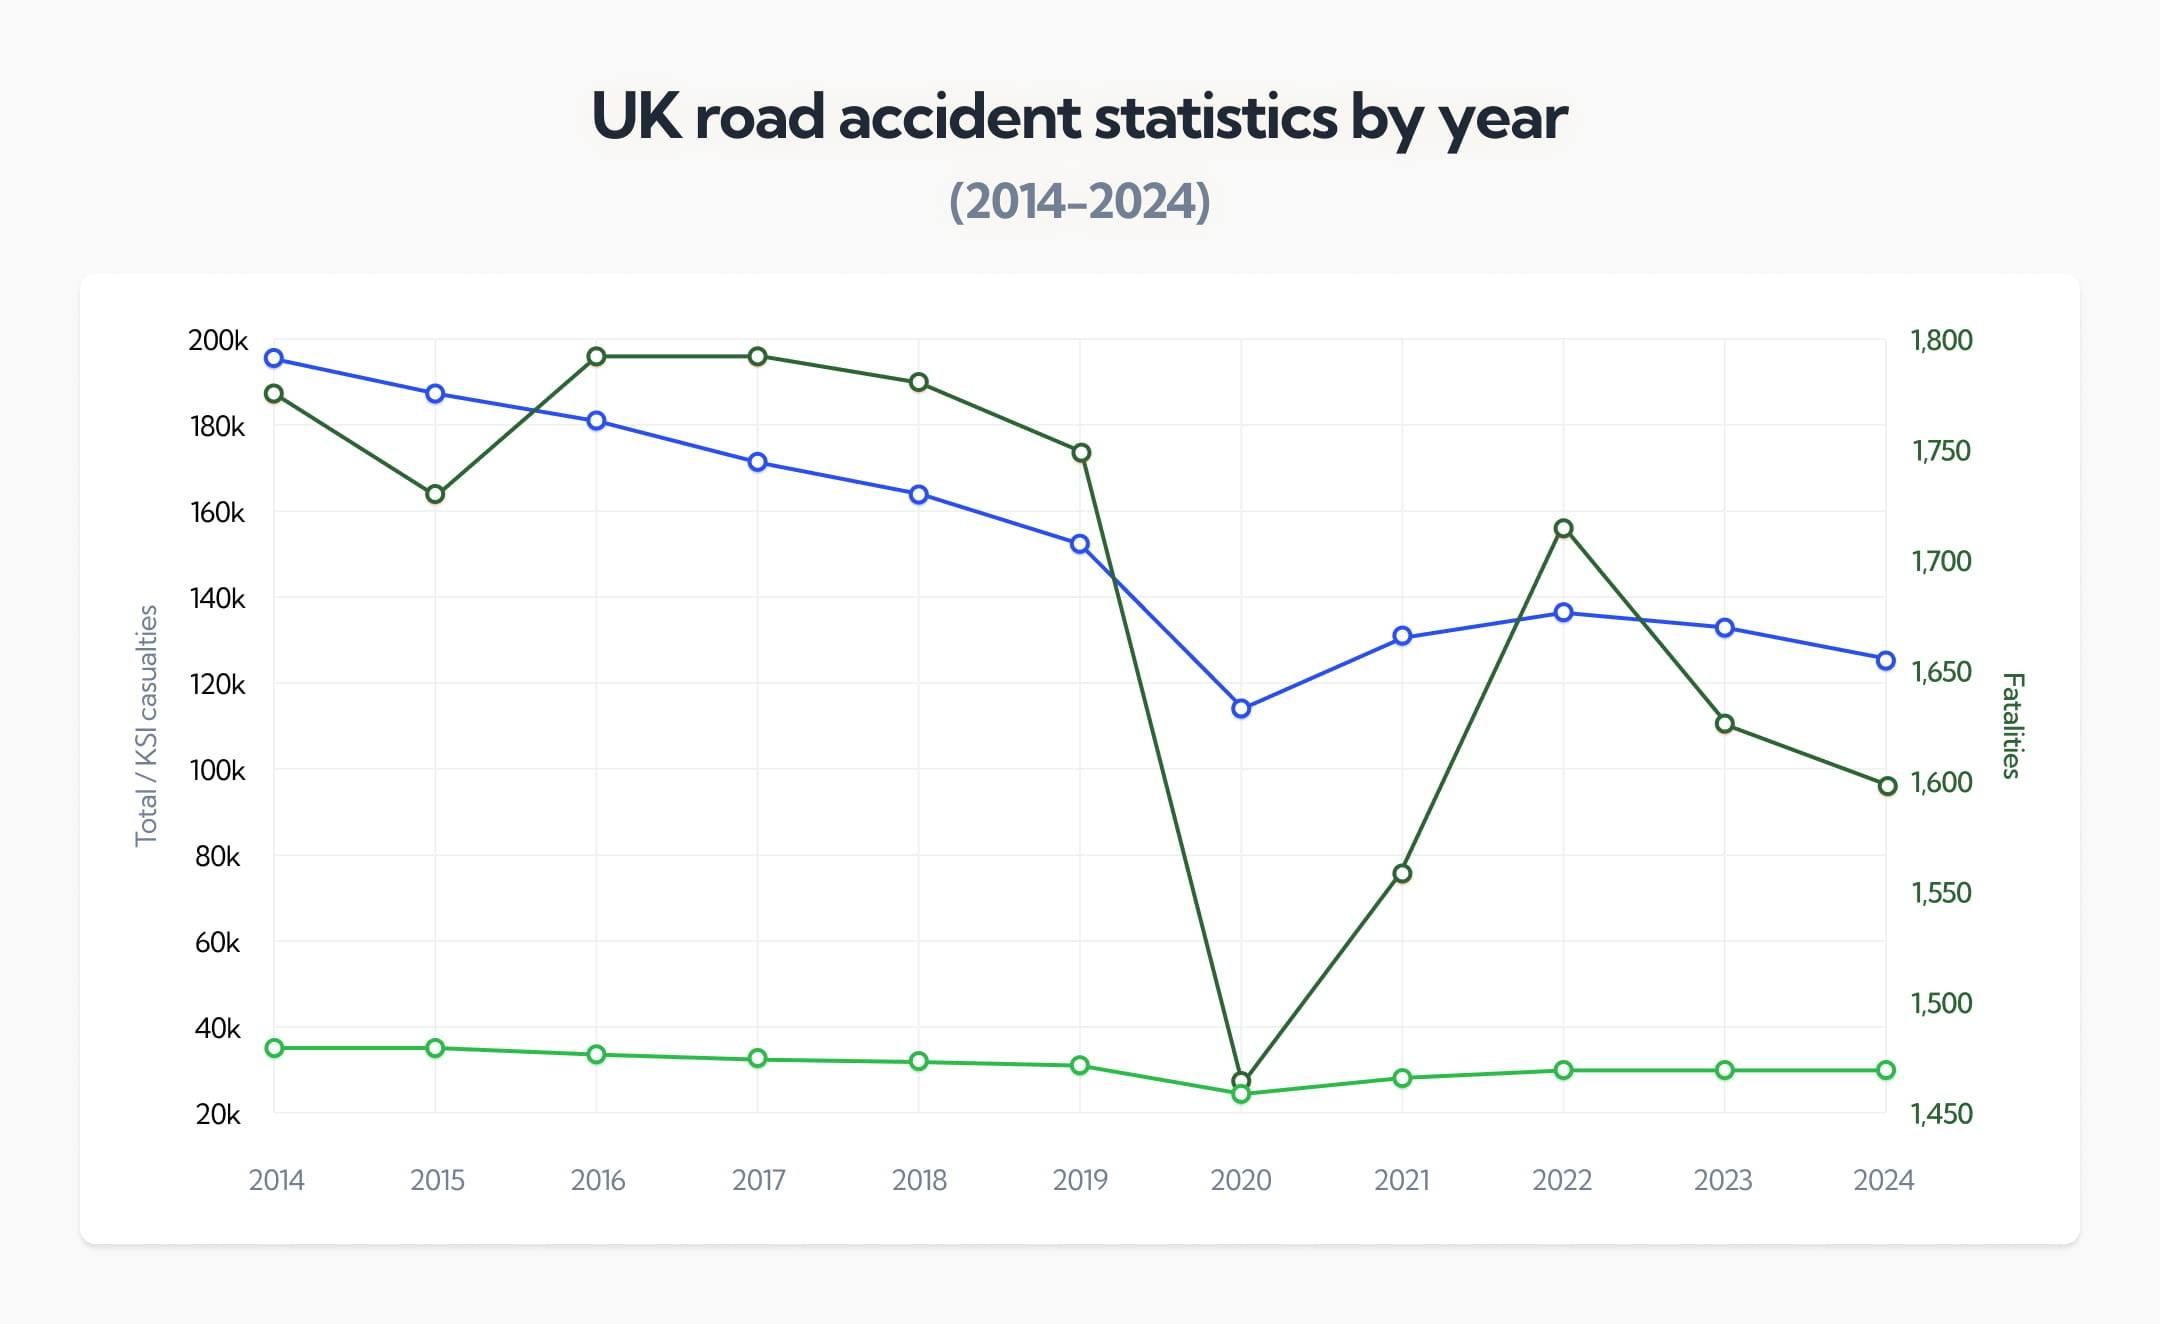
Around 128,000 to 133,000 total road accidents are recorded on UK roads each year. In 2024, Great Britain recorded 128,272 casualties of all severities – a figure that includes everyone killed, seriously injured or slightly injured in a reported collision.
As you can tell, the headline number has dropped sharply since 2014. Total casualties are down 34% over the decade, and the rate of casualties per billion vehicle miles fell from around 610 in 2014 to 378 in 2024 (a 38% reduction). On that basis, roads are meaningfully safer than they were ten years ago.
The more complicated picture is in the KSI figures. Killed or seriously injured casualties stood at 29,467 in 2024 – down just 14% from 34,335 in 2014 and down only 1% from 2023. Outside the pandemic years (when traffic volumes collapsed and collisions dropped with them), there has been no significant sustained reduction in KSIs across the decade. The overall casualty count has fallen largely because slight injuries are down 38% since 2014, with the more severe end of the scale proving much harder to shift.
The 2020 and 2021 figures reflect the impact of COVID-19 lockdowns, which reduced traffic to historically low levels. Casualties rebounded as traffic returned, and by 2024, vehicle miles travelled in GB had recovered fully to pre-pandemic levels at 340 billion miles.
How many road accidents happen per day in the UK?
In 2024, Great Britain recorded 128,272 road accidents across the year, which works out to roughly 351 casualties every single day. Of those, approximately 4.4 people were killed daily and around 80 people were killed or seriously injured.
UK road accident statistics by year (2014-2024)
The numbers tell a clearer story visually than in a table. Total casualties have fallen quite a bit since 2014, but the KSI line – which tracks the most serious outcomes – has barely moved over the past five years. The COVID dip in 2020 stands out sharply across all three measures.
How many people die in car accidents in the UK each year?
In 2024, 1,671 people were killed on UK roads, 1,602 of those in Great Britain (England, Scotland and Wales) and a further 69 in Northern Ireland.
It's worth keeping that distinction clear: Great Britain's figures come from the Department for Transport via the STATS19 system, while Northern Ireland publishes its own data separately through the PSNI. Most road safety statistics you'll see quoted refer to GB only.
Total road accident fatalities in the UK (2014-2024)
The GB fatality count fell 1% between 2023 and 2024, and is down 10% compared to 2014. At first glance that looks like meaningful progress, but zoom out and the picture is less encouraging.
Since around 2010, road deaths in Great Britain have plateaued, fluctuating within a relatively narrow band rather than continuing the steep downward trend seen through the 1980s and 1990s. The 2020 dip was driven almost entirely by COVID lockdowns reducing traffic, not by any structural safety improvement.
Adjusting for the average distance driven shifts the picture slightly. The fatality rate in 2024 stood at 4.7 deaths per billion vehicle miles, a 15% reduction from 2014, which suggests the roads have become somewhat safer relative to the volume of traffic. But in absolute terms, over 1,600 people still lose their lives every year.
Age is a significant factor in who dies. In 2024, nearly a quarter (22%) of fatalities were aged 70 and over, and a further 22% were aged between 17 and 29. Children aged 16 and under accounted for only 4% of road deaths.
How many people die in car accidents each day in the UK?
Based on 2024 figures, around 4.6 people die on UK roads every day. That equals roughly one death every five hours. To put that another way, by the time most people finish a working day, at least one more life has been lost on British roads.
Car accidents by road user type in 2024
Car occupants make up the largest share of road deaths in absolute terms, while buses, coaches, LGVs and HGVs combined make up fewer than 4% of the total.
That said, car drivers are also the most numerous road users by far. When you look at who is actually dying relative to how much they travel, the picture shifts considerably: motorcyclists and pedestrians face a disproportionately higher risk than the raw numbers suggest.
Taken together, pedestrians, cyclists and motorcyclists – who are classed as ‘vulnerable road users’ – made up 52% of all fatalities in 2024 despite representing a small fraction of total vehicle miles travelled. That imbalance is one of the defining features of UK road safety data.
Beyond that, a few figures stand out. Motorcyclist deaths rose 8% year-on-year, continuing a trend that has shown no meaningful improvement since 2014. Pedestrian fatalities edged up 1%, with two-thirds of those deaths involving a collision with a car. And among car occupants, a third of fatalities happened in single-vehicle accidents, due mainly to loss of control and road conditions.
Cyclist deaths, by contrast, fell 6% in 2024 and are down 27% since 2014. That’s the strongest improvement of any road user group over the decade.
UK road deaths by country (England, Wales, Scotland, Northern Ireland)
The 1,671 people killed on UK roads in 2024 were not evenly distributed across the four nations.
Of course, England accounts for the vast majority of road deaths by sheer volume of traffic and population, but the per-capita picture looks quite different.
For instance, Scotland recorded a fatality rate of 29 deaths per million population in 2024, which is 25% higher than the rate for England and Wales. That largely reflects its higher proportion of rural roads, faster average speeds and longer emergency response times.
Casualty rates per billion miles by road user type
Raw fatality counts only tell part of the story. To understand actual risk on the road, you need to account for how far each type of road user travels. And when you do, the gap between different groups becomes stark.
The motorcyclist figure is the one that commands attention. At 115.2 fatalities per billion miles, motorcyclists are approximately 43 times more likely to be killed per mile travelled than car occupants. And their all-casualty rate (covering every severity of injury) is nearly 20 times higher than for car occupants: 5,408 per billion miles versus just 274.
As for pedestrians and cyclists, they sit in the middle. Both figures are substantially higher than for car occupants, which matters given the push toward active travel across UK cities. More people walking and cycling is a broadly positive trend, but it’s one which requires infrastructure that actually reflects the risk those people face on the road.
Car occupants, despite accounting for 43% of all fatalities in absolute terms, have by far the lowest fatality rate of any group once you factor in distance travelled. The safety improvements built into modern vehicles over the past two decades are a big part of why.
Road accident statistics by age and gender
Road casualty data breaks down sharply along age and gender lines. Men are involved in collisions at significantly higher rates than women across every age group, and the age groups most at risk shift depending on whether you're looking at total casualties or fatalities specifically.
The following sections examine where the risks concentrate and how the picture has changed over the past decade.
Which age group causes the most road accidents in the UK?
According to DfT, drivers aged 17 to 29 account for 28% of all road casualties in the UK, making them the highest share of any age group. This is mostly due to inexperience and risky behaviour on the road. However, they represent only 22% of fatalities, suggesting their collisions tend to be less severe than those of older drivers.
Those aged 30 to 49 account for the highest share of road deaths, at 26.94% of total fatalities in 2023, and recorded the most total casualties of both sexes in 2024 (25,048 male and 15,814 female).
Higher annual mileages and more frequent use of faster rural roads push their fatal crash rate above younger drivers despite fewer total incidents.
Car accident statistics by gender in the UK
Men are significantly overrepresented in UK road fatalities at every age. In 2024, 76% of all deaths on the road were male, as were 61% of all accidents.
The rise in male fatalities among 50-69 year olds is the most notable shift in 2024, as it’s a 23% YoY increase in a group that tends to drive higher mileages on faster roads. On the other hand, the improvement among young drivers of both sexes since 2014 is one of the more encouraging trends in the decade's data.
Child road accident deaths and injuries in the UK
Despite being among the most protected road users in policy terms, children under 16 still make up a disproportionate share of casualties – 11% of the total in 2024, with 46 killed across all road user types.
The seatbelt figure is perhaps the most troubling stat in this group: 42% of children killed as car passengers had nothing restraining them at the time of impact, a failure that rests entirely with the adults who put them in the vehicle.
Car accident statistics for older drivers
Older road users account for a large (and growing) share of fatalities. Those aged 70 and over made up 22% of all road deaths in 2024, and male fatalities in the 70+ group have risen 15% since 2014, likely because the UK is an ageing population, and because that age group drives more miles than they have in previous decades.
In particular, male fatalities in the 50 to 69 age group rose 23% from 2023 to 2024. This group tends to drive longer distances on faster roads and frailty means that collisions which younger drivers might survive are more likely to prove fatal.
What are the most common causes of car accidents in the UK?
From 2024, the old Contributory Factors (CF) system has been replaced by Road Safety Factors (RSFs), which is a revised coding framework focused on areas where action can reduce harm. Around 25% of 2024 collisions were recorded natively under RSFs, with the rest converted from the old CF system.
On that basis, the leading causes of fatal and serious collisions in 2024 were:
- Ineffective observation: This covers situations where a driver, rider or pedestrian failed to look properly before acting. It’s the #1 most commonly recorded road safety factor across fatal collisions, contributing to 37.6% of them.
- Aggressive, dangerous or reckless driving or riding: The second most common factor.
- Speed: Contributed to 59% of road deaths, with 21% involving an outright speed limit breach and 29% involving either a breach or travelling too fast for conditions
- Loss of control: Attributed to around 24% of road fatalities in 2022, the most recent year this breakdown is available.
Keep in mind, though, that most accidents involve a combination of causes. When police attend an injury collision, they can record up to six contributing factors per incident.
How many car accidents are caused by drink driving in the UK?
Around 300 people are killed in drink-drive collisions every year in Great Britain, which works out to ~18% of all road deaths. In 2022, the most recent year with full estimates, 6,800 people were killed or injured in drink-drive crashes. Averaged over recent years, that works out at 297 killed, 1,415 seriously injured and 7,817 slightly injured annually.
In total, 36,415 people were convicted of drink driving offences in England and Wales in 2024, according to Ministry of Justice data, with 82% of them male. And the problem may be getting worse among younger drivers: RAC figures from 2025 show 18% of under-25s admit to driving over the legal limit, which is up from 15% the previous year.
Seasonally, January, July and August consistently record the highest rates of drink-drive collisions. The festive period and peak summer socialising naturally lead to more instances of drinking excessively before getting behind the wheel.
Drug driving statistics in the UK
In 2022, illegal drugs were detected in 127 deceased drivers, with a further 61 returning inconclusive results and 27 testing positive for prescribed medication. The problem is concentrated among younger drivers: illegal substances were most commonly found in deceased drivers aged 20 to 39.
Drug driving is an increasingly serious parallel concern with drink driving. A December 2024 enforcement operation by the NPCC found 42.2% of roadside drug wipes returned a positive result, with 2,782 people arrested for both drink and drug driving offences combined. DfT data shows the number of deceased drivers with drugs detected rose by more than 70% between 2014 and 2022.
That said, the gap between alcohol- and drug-impaired fatal crashes has narrowed significantly since 2014. This reflects both the long-term decline in drink driving and a rise in drug driving – a shift enforcement agencies and road safety organisations have been flagging for several years.
What percentage of car accidents in the UK are caused by excessive speeding?
According to the 2024 RAS0701 report from the Department for Transport, speed is a factor in 41% of all reported collisions in the UK and 59% of fatal ones. It’s the single most pervasive theme in road safety data.
Exceeding the posted limit, specifically, was recorded in 7.1% of all collisions and in 21% of fatal ones. Travelling too fast for conditions (i.e. within the limit but inappropriate for the circumstances) accounted for a further 16%. Combined, those two account for 29% of road deaths.
It’s worth mentioning, also, that speed rarely operates alone. It frequently overlaps with ineffective observation and aggressive driving, but its presence in the majority of fatal collisions makes it the most consequential factor in the data.
How often does distracted driving lead to car accidents in the UK?
Mobile phone use was a contributing factor in 2.2% of fatal crashes and 0.68% of all reported crashes in Great Britain in 2024, according to DfT’s RAS0701 data. When you add in distractions from inside, outside or on the vehicle (another 7.6% fatal and 5.29% total crashes), distractions make up 9.8% of fatal collisions and 5.97% of total collisions.
Those figures almost certainly understate the true picture, though. Police can only record mobile use as a factor when there is evidence at the scene, making it one of the most underreported causes in the data.
Self-reported behaviour from the RAC’s 2024 Report on Motoring tells a very different story:
- 55% of drivers under 25 admitted to making or receiving calls while driving.
- 43% of younger drivers said they listened to voice notes without hands-free.
- 40% admitted to recording voice messages at the wheel.
- 30% of young drivers admitted to video calling while driving.
And according to the UK’s Ministry of Justice, 15,300 drivers were prosecuted for handheld mobile phone use while driving in 2023.
What percentage of UK car accidents are caused by inexperienced drivers?
According to the Department for Transport, drivers and riders aged 17 to 29 accounted for 22% of all road fatalities in 2024 and 28% of total casualties in car accidents. That’s a disproportionate share given they represent a relatively small slice of licence holders and total miles driven.
Provisional Table 4 of DfT’s data set reveals how stark the gender split is here. Male fatalities in this age group totalled 294 in 2024, while female fatalities stood at 67. However, both figures do represent meaningful progress over the decade (down 27% and 34% respectively since 2014), and the 17-29 group showed the largest percentage reduction in casualties of any age group compared to 2023.
That improvement is encouraging, but the overrepresentation is a persistent problem. Young drivers are more likely to speed, less likely to recognise hazards early and more likely to be driving at night or with peer passengers, all of which compound risk.
Road safety charity Brake has long campaigned for a graduated licensing system in the UK, which would impose restrictions on new drivers (including limits on night driving and passenger numbers) during the first years after passing their test, as is already the case in several other countries.
What the experts say

Steven Jackson OBE

What impact do dangerous road conditions have on car accidents?
Dangerous road conditions pretty much always cause the number of car accidents to go up. There are tons of ways this could happen:
- Poor or defective road surfaces
- Deposits on the road
- Surfaces that are slippery due to the weather
- View obstruction by vehicles, vegetation, buildings or road signs/layout
- Adverse weather conditions or dazzling sunlight that affects drivers’ vision
When you combine those five factors, RAS0701 data puts these at 15.9% of all accidents, and 12.7% of fatal ones.
Road conditions affect cyclists, too. 56% of pedal cycle fatalities between 2020 and 2024 occurred on rural roads, despite rural roads accounting for just 31% of total cycle traffic.
How many car accidents in the UK are caused by tailgating?
Tailgating is a factor in 1 in 8 crashes on the National Highways network, and according to research from IAM Roadsmart, 81% of drivers have been tailgated in the past 12 months. It’s the number-one cause of rear-end collisions in the UK, and around 400,000 rear-end collisions happen annually.
Seatbelt use and car accident fatalities
A quarter of all car occupants killed on UK roads in 2024 were not wearing a seatbelt. It’s a straightforward and (perhaps the most) preventable factor in a significant share of road deaths.
The breakdown by group makes for stark reading:
- 20% of drivers killed were unrestrained at the time of the crash, rising to 34% among passengers.
- 39% of car occupant deaths between 6pm and 8am involved someone without a seatbelt on.
- 41% of 17- to 29-year-olds killed in cars weren’t wearing a seatbelt.
- 42% of children under 16 who died as car occupants were found to be not properly restrained.
Seatbelt non-compliance is consistently higher at night, among younger occupants and among passengers rather than drivers.
How many fatal road traffic accidents happen in the UK each year?
DfT reported that 1,602 people were killed in road collisions in Great Britain in 2024 the lowest figure on record outside the COVID-affected years of 2020 and 2021. Including Northern Ireland, the UK total stands at 1,671.
That represents a 1% decline on 2023 and a 10% reduction since 2014 – modest progress over a decade and largely flattening out after the steep improvements seen in earlier years.
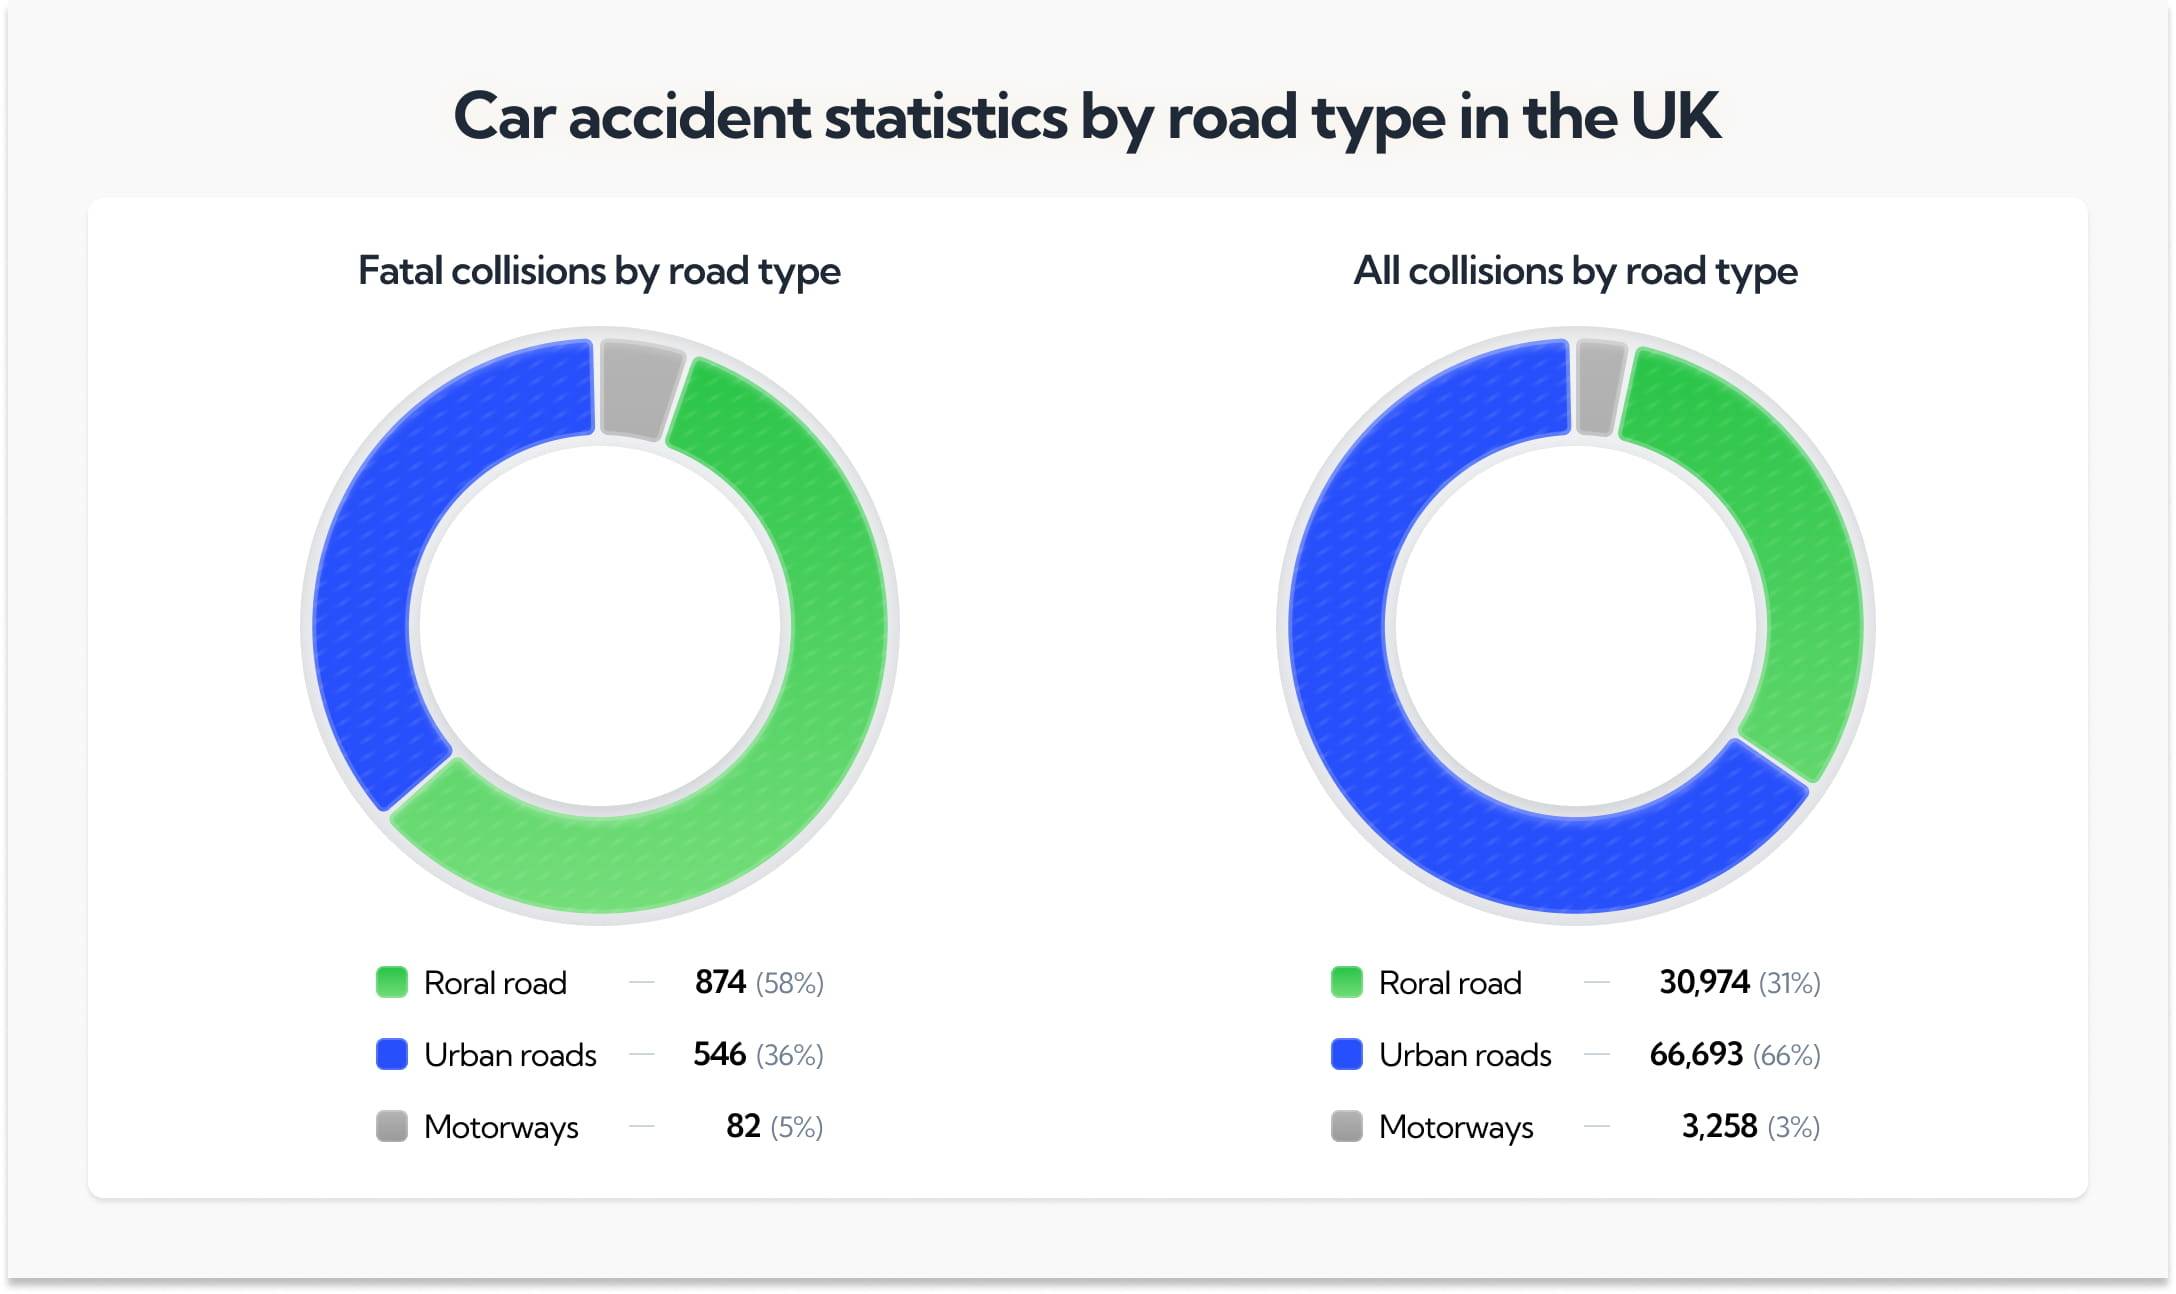
Car accident statistics by road type in the UK
Most people assume motorways are the most dangerous roads in the UK. The data tells a very different story:
How many car accidents happen on motorways in the UK?
Motorways feel dangerous but are statistically the safest roads in Britain. Despite carrying a fifth of all GB traffic, they account for just 6% of road deaths. So, you’re less likely to be in a collision on a motorway compared to both urban and rural roads.
Controlled access, physical separation of opposing lanes and no junctions or pedestrians make them structurally far safer than their speed limits suggest.
That said, motorways and A-roads together make up ~15% of road length but ~60% of fatal crashes, including 40%+ of serious ones. The main contributing factor to the higher fatality and casualty rates is the higher speed limits, which make for more consequential accidents when one does happen.
What percentage of fatal car accidents occur on rural roads?
RAS0302 reports that 2024, rural roads saw a total of 874 fatalities, or 58.2% of all fatal collisions. Broken down, that looks like:
- Rural A-roads: 574 fatalities (38.2%)
- Rural other roads: 300 fatalities (20.0%)
The majority (56%) of pedal cycle fatalities happen on rural roads as well.
How many car accidents happen on A-roads in the UK?
According to data from RAS0302, 44,142 total collisions happened on A-roads in the UK in 2024 (44% of all collisions). Urban A-roads made up 28,122 of that total, while rural A-roads made up 16,019 of it.
Note: The Road Safety Foundation's crash risk mapping tool shows the risk level for every motorway and A-road in Britain, classified from low to high risk with colour-coded risk bands.
UK car accident statistics by region
Accidents aren’t evenly distributed across Britain. The South East records the highest fatality count of any English region, while London, despite generating by far the most total casualties, has one of the lower fatality figures relative to its size and traffic volume.
Below you’ll find the full breakdown per Department for Transport’s RAS0402 2024 data:
London is the obvious outlier. Its 24,042 total casualties dwarf every other region due to its large population, yet its fatality count of 110 is one of the lowest. That reflects the reality of urban driving: more collisions overall, but lower speeds mean fewer are fatal. In fact, 80% of London's road deaths in 2024 involved someone walking, cycling or riding a motorcycle rather than just two or more vehicles.
The inverse is true in rural areas. The East Midlands and South East, for example, both recorded fewer total casualties than London but significantly higher fatality counts because higher average speeds make the accidents that do happen deadlier.
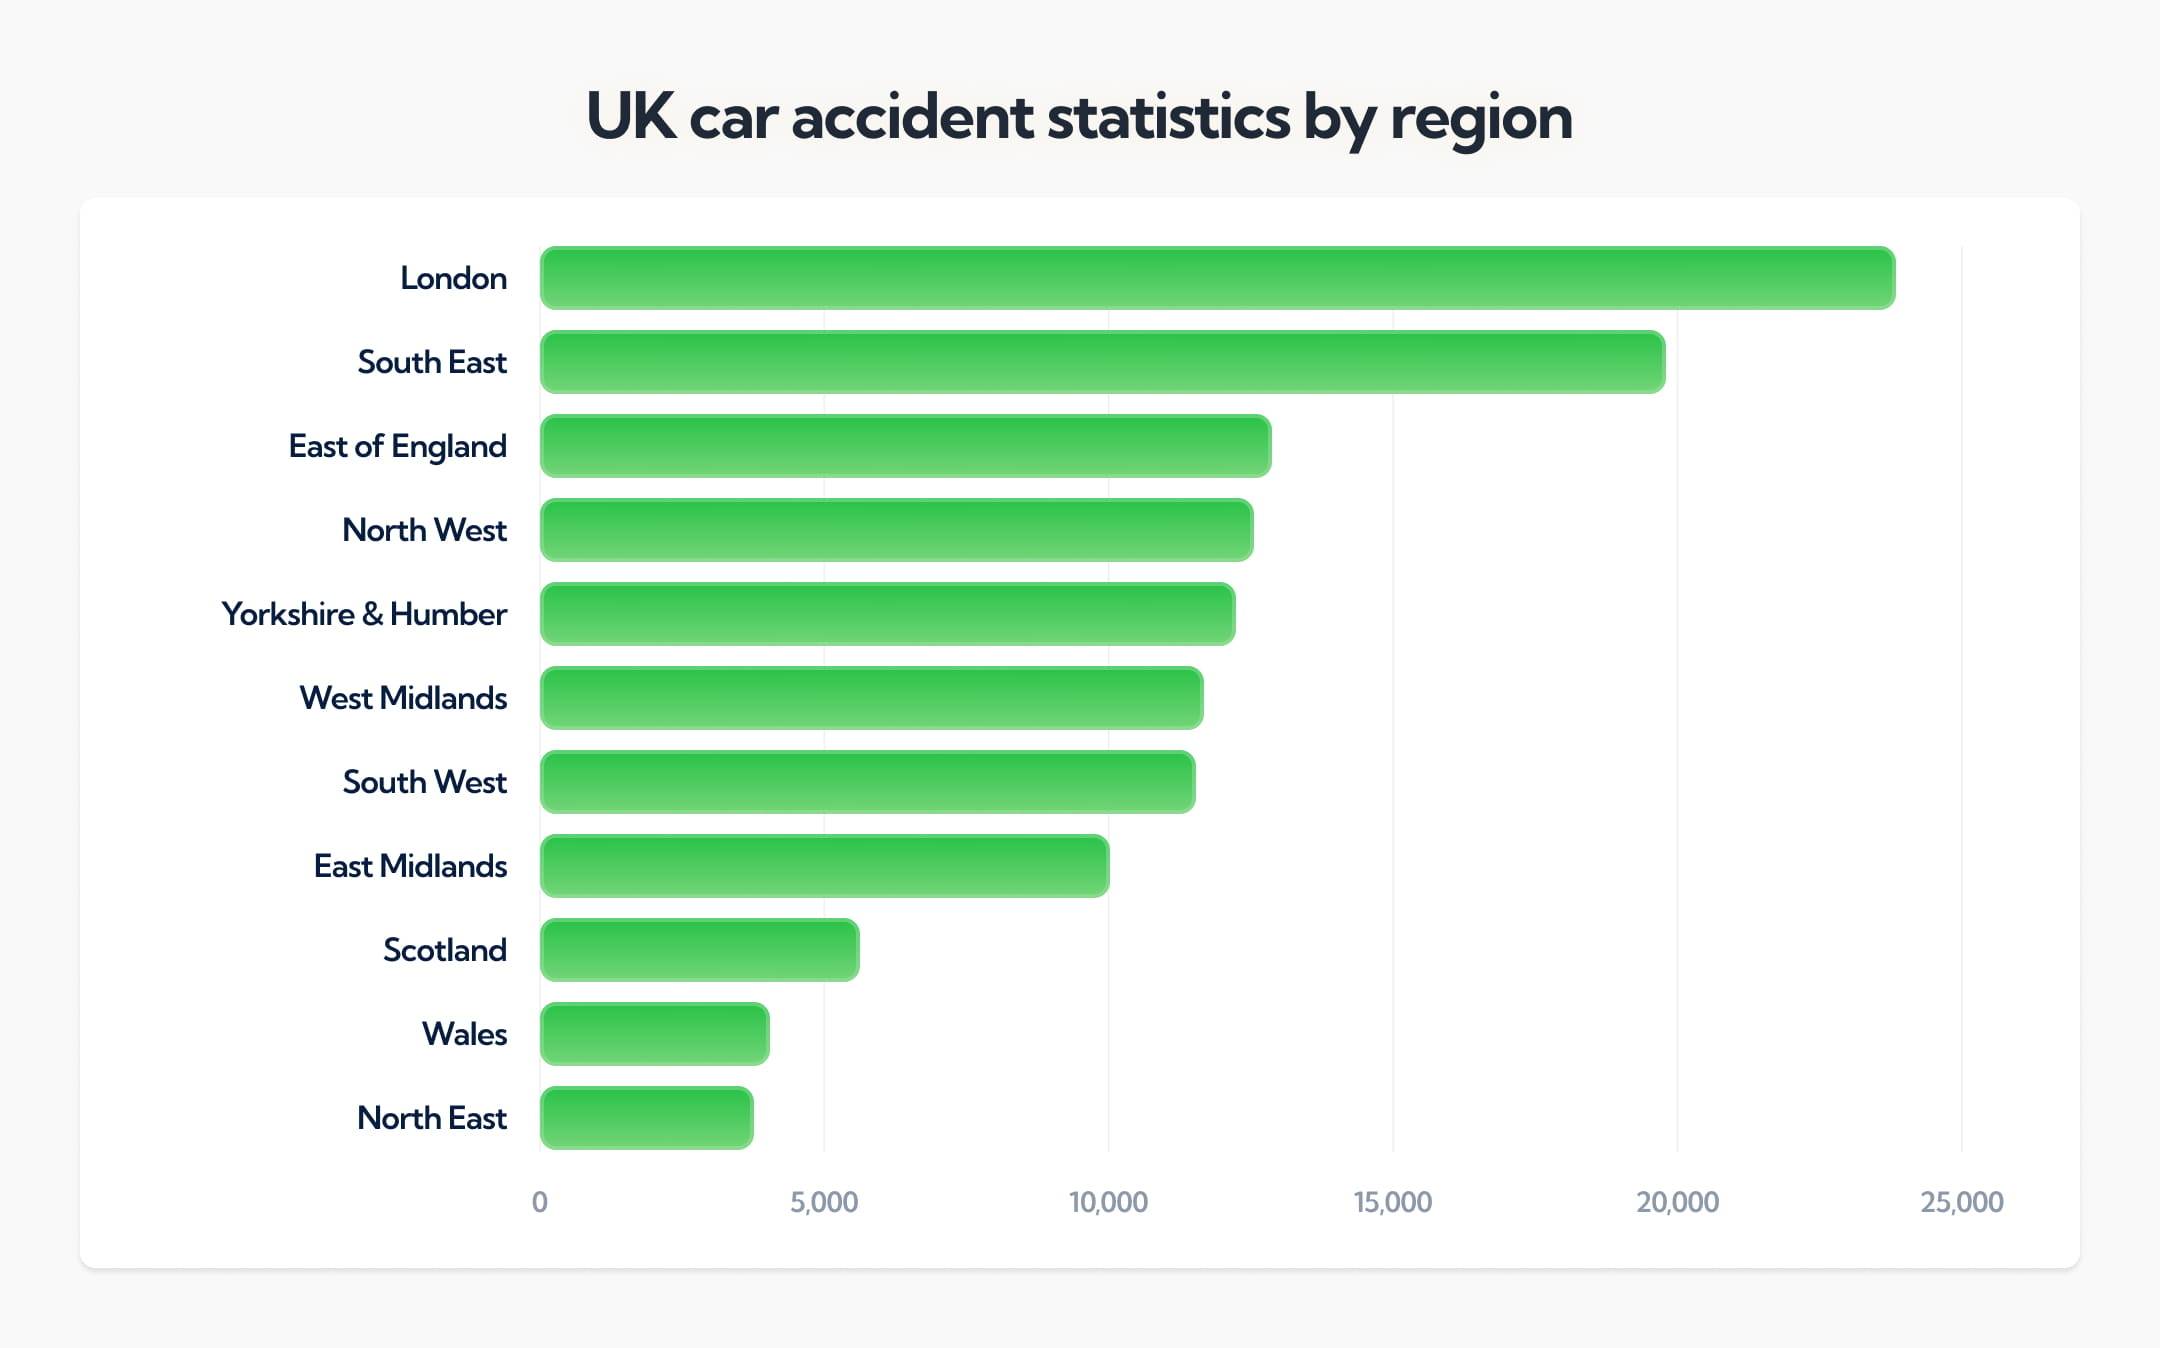
That said, once you visualise it, you realise the fatal slice is tiny relative to total casualties in every region. This actually reinforces the point about London: its bar is by far the longest but its orange slice is proportionally smaller rather than larger.
Top 10 UK cities with the highest car accident risk
According to an analysis from CHAS, the 10 UK cities with the highest car accident risk are as follows:
Car accident statistics for England
England accounts for the vast majority of UK road casualties by volume: 1,353 deaths, 24,697 serious injuries and 118,546 total casualties in 2024. This is due to both its larger population and higher traffic density compared to the other nations.
Car accident statistics for Scotland
Scotland recorded 165 deaths, 1,977 serious injuries and 5,725 total casualties in 2024. On a per-capita basis, Scotland's fatality rate runs around 25% higher than England and Wales, which is largely thanks to its extensive rural road network and longer average journey distances.
Car accident statistics for Wales
Wales recorded 84 deaths, 1,190 serious injuries and 4,001 total casualties in 2024. Wales introduced a default 20mph speed limit on restricted roads in September 2023 — the data over the coming years will be closely watched as a real-world test of whether nationwide urban speed reductions translate into measurable casualty reductions.
Car accident statistics for Northern Ireland
Northern Ireland recorded 69 deaths, 939 serious injuries and 7,494 total casualties in 2024, collected separately from GB figures by the Police Service of Northern Ireland rather than the DfT's STATS19 system. NI's fatality rate per million population has historically run higher than Great Britain, though 2024 showed a modest improvement on the previous year.
How does London compare to other UK regions?
London consistently outperforms the rest of Great Britain on KSI reduction. Its sustained investment in road safety infrastructure, expanding 20mph zones and TfL's Vision Zero programme (which targets a 70% reduction in killed and seriously injured casualties by 2030 against a 2010-14 baseline) all play a role in this.
However, even within London, there are differences. In January 2023, TfL launched its Inequalities in Road Danger dashboard. It’s the first of its kind in Europe and maps how road risk falls across different deprivation levels in London to enable more targeted intervention and address those differences.
UK car accident statistics by time of day, week and month
Road collisions aren't totally random. They cluster around predictable patterns of time, day and season. Understanding when accidents are most likely to happen is one of the more practical insights road safety data can offer.
Here's what the numbers show:
What time of day do most car accidents happen in the UK?
Rush hour carries the highest collision risk on weekdays. According to an analysis from UK personal injury attorney Sampson Millar, 4pm and 5pm are the times there’s most likely to be a car accident.
As for cyclists, DfT data shows cyclist KSIs peak between 7-10am and again between 4-7pm, patterns that broadly reflect overall traffic volumes.
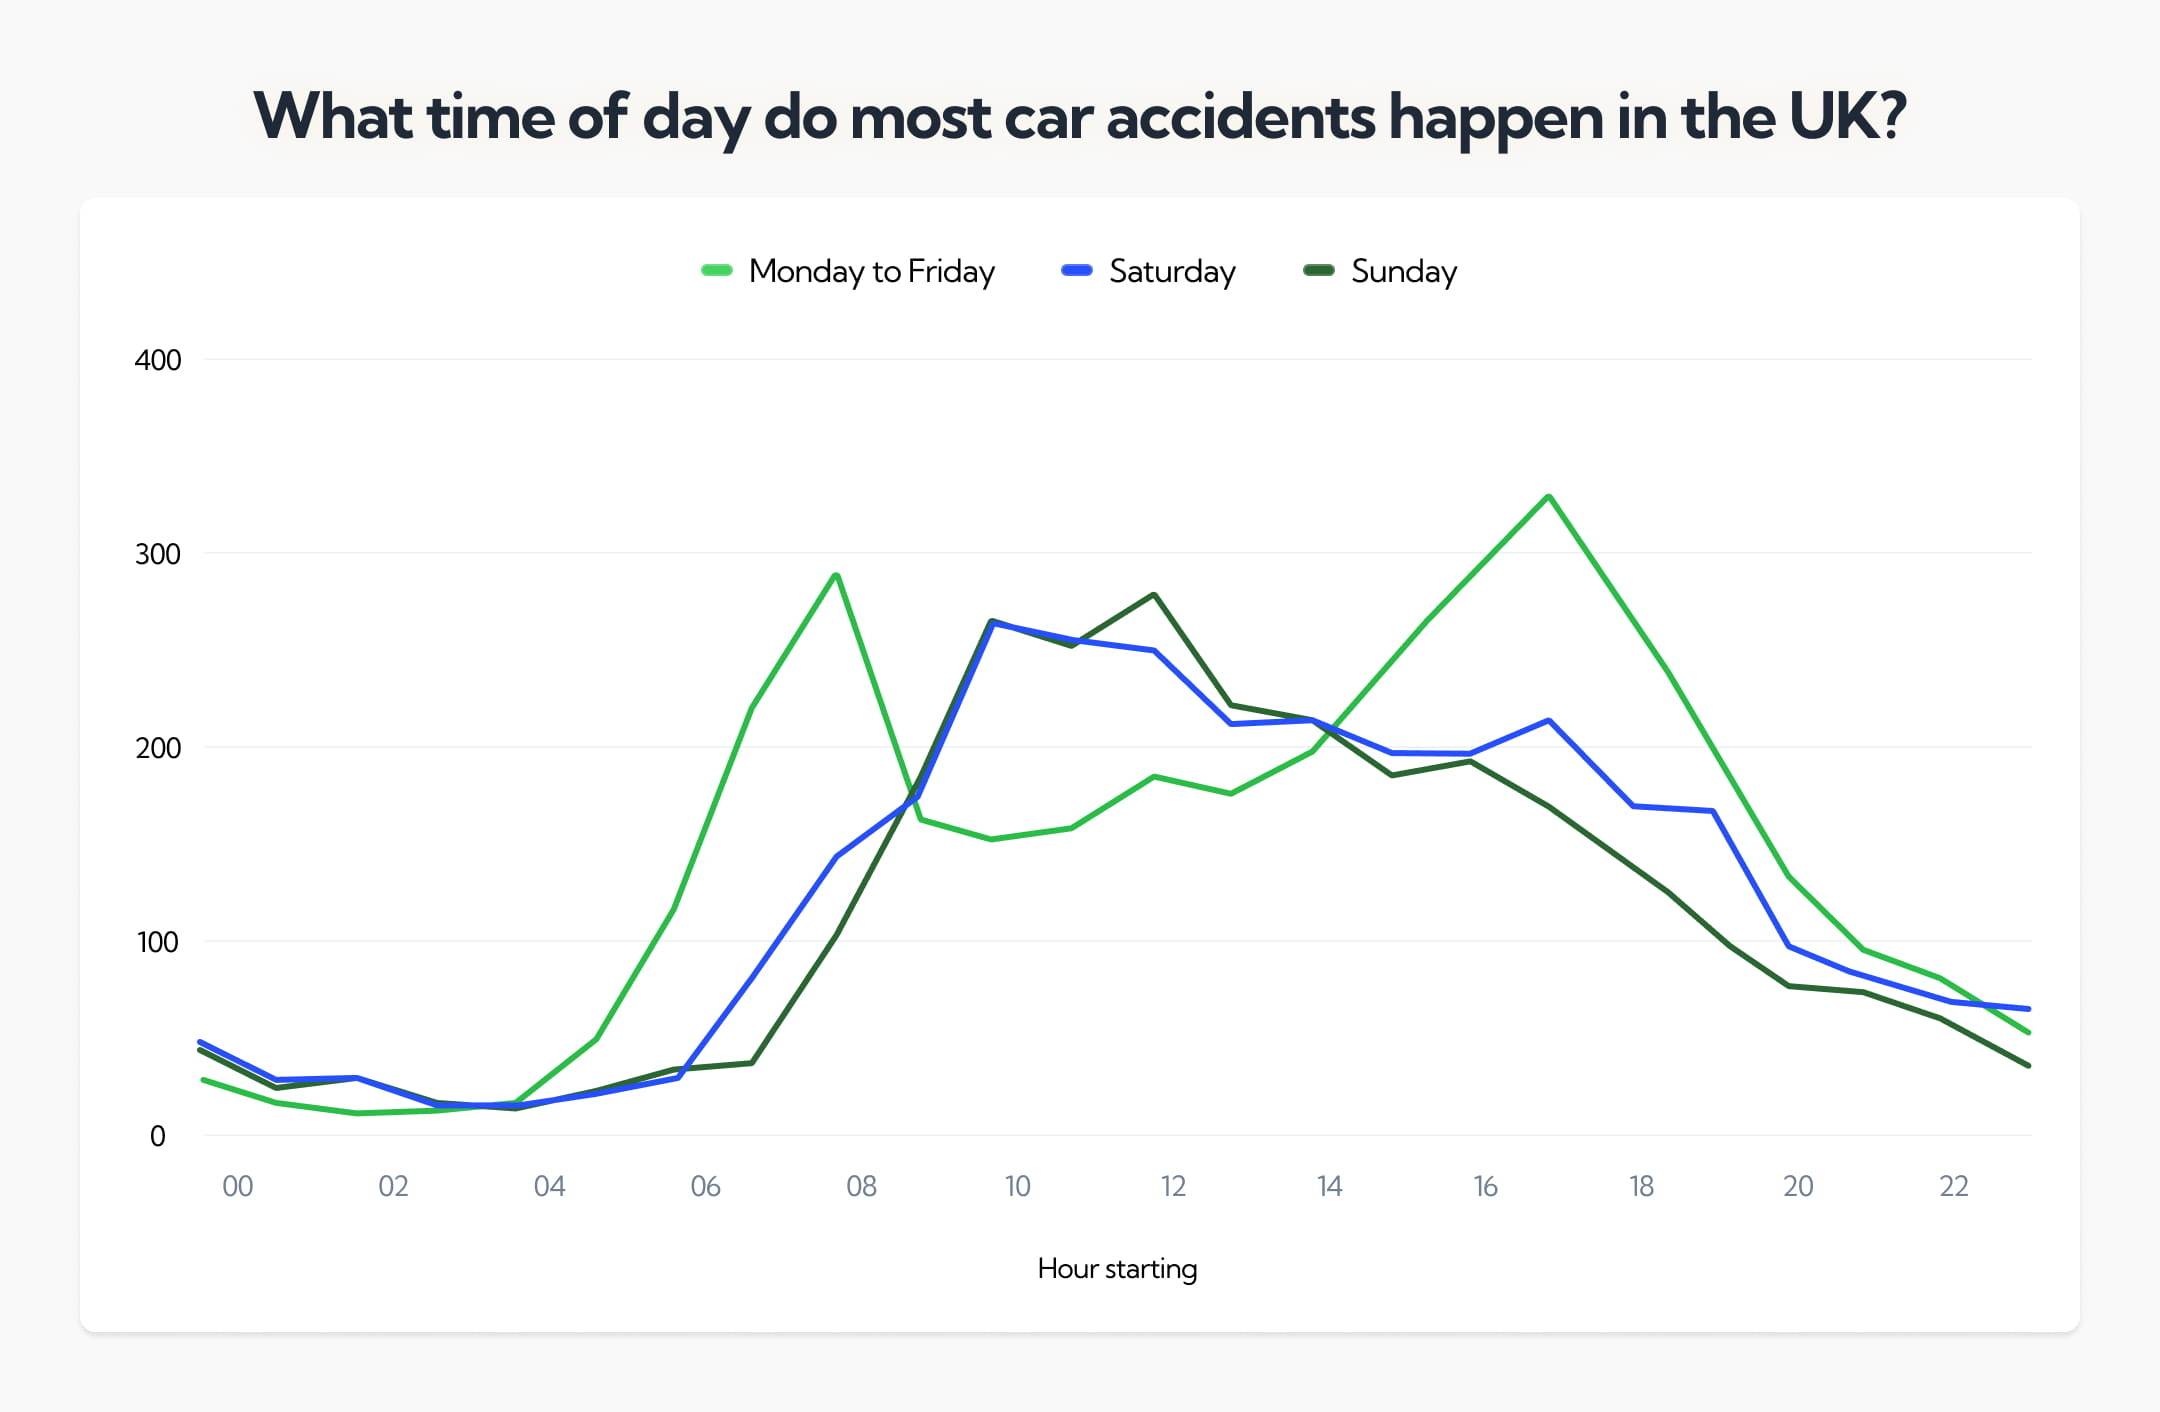
After dark the risk profile shifts: Brake reports that 39% of car occupant fatalities in evening and night hours (6pm to 8am) involved someone not wearing a seatbelt. And alcohol-related collisions are heavily concentrated between 10pm and 4am, when impaired drivers are most likely to be on the road.
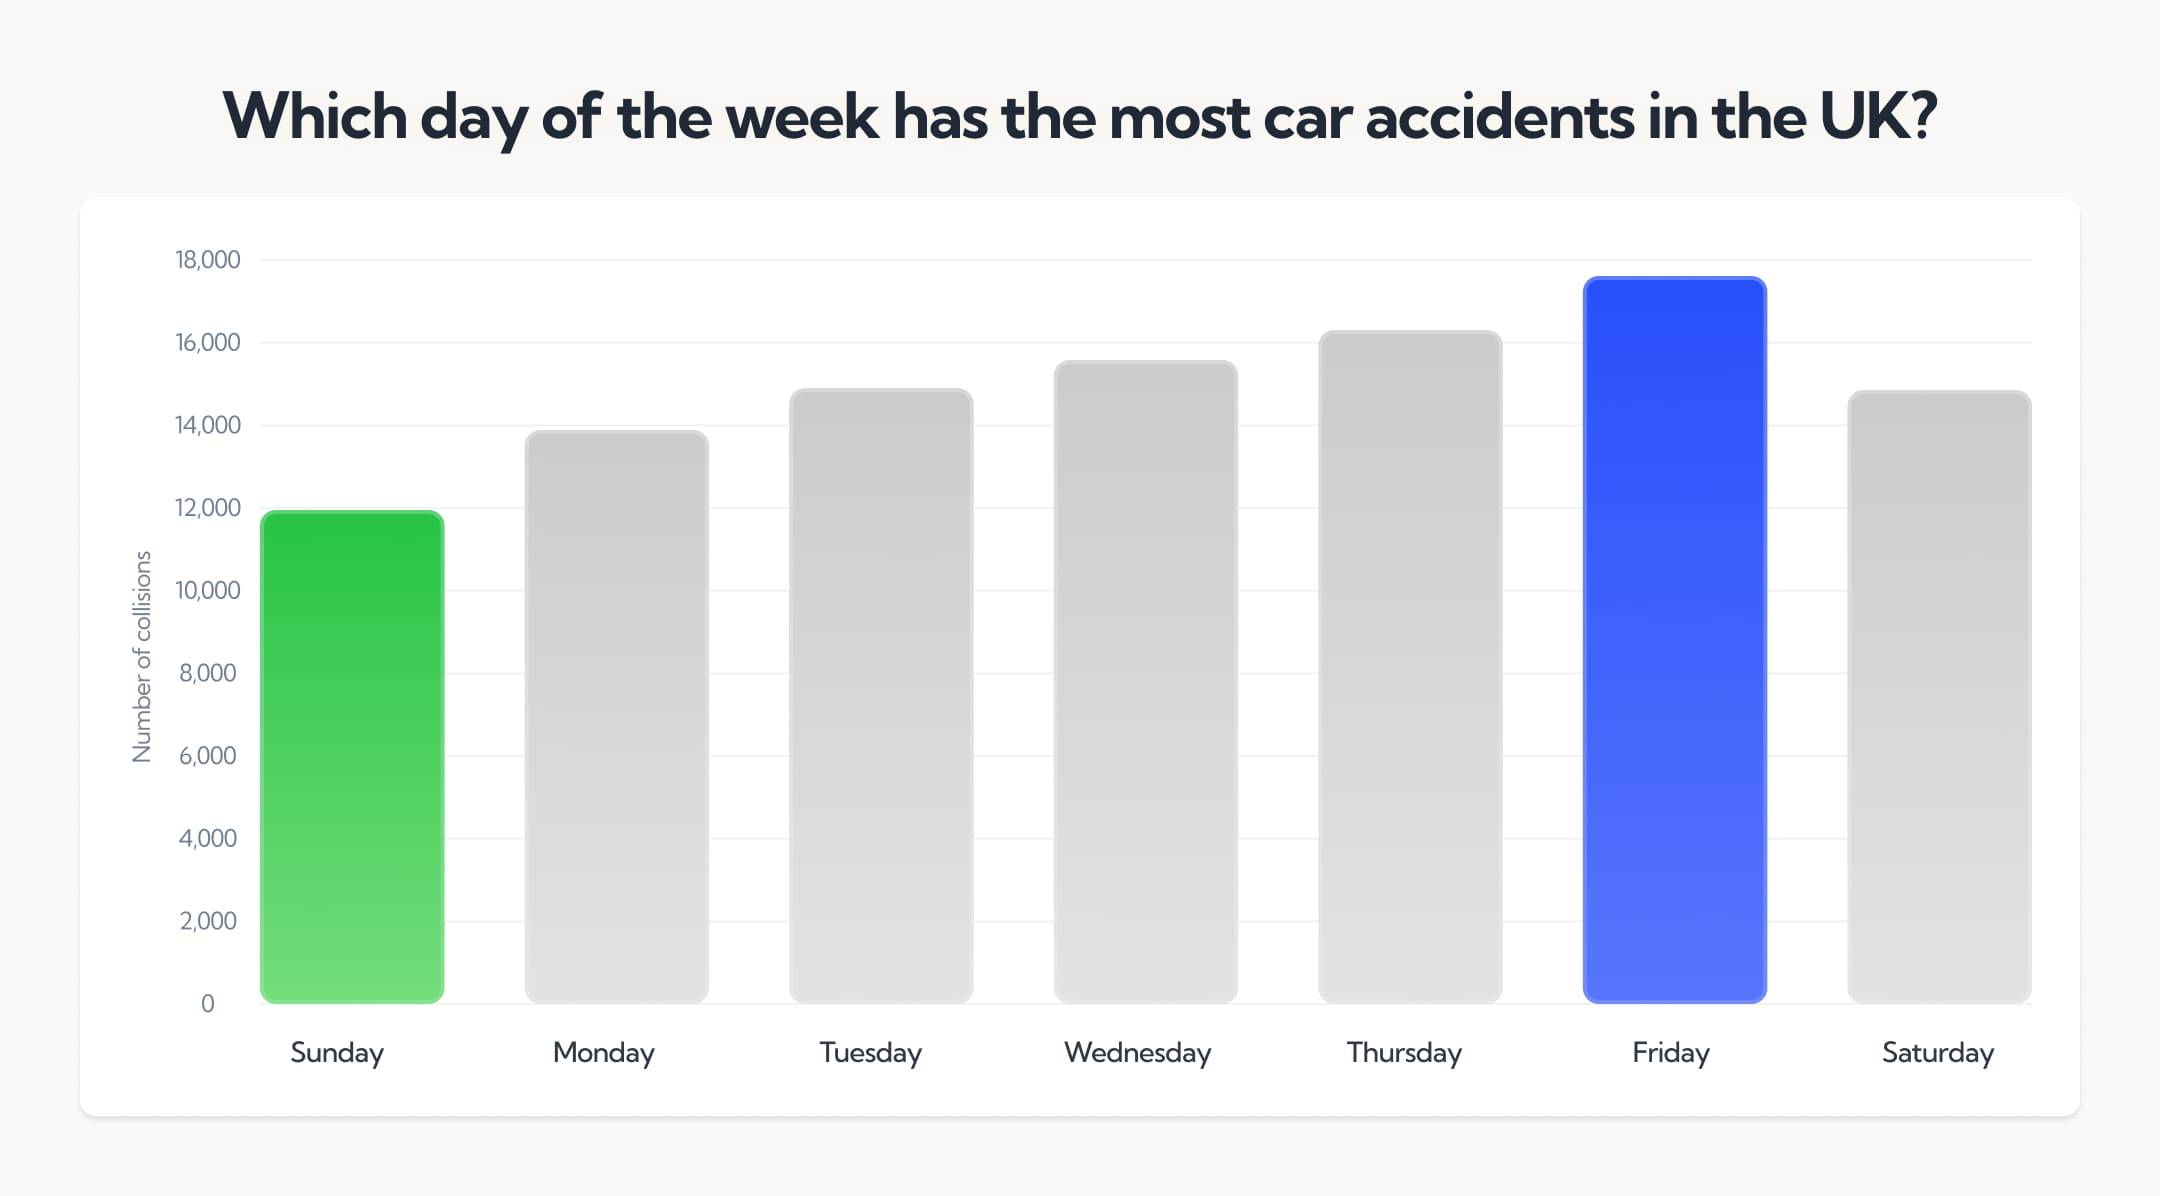
Which day of the week has the most car accidents in the UK?
Friday is consistently the most dangerous day on UK roads. Analysis of STATS19 data by Simpson Millar found Friday generates more collisions than any other day. This is a pattern that’s most likely driven by a combination of factors: end-of-the-week fatigue, higher traffic volumes and school holiday travel spikes.
Sunday is the safest day, with around 32% fewer collisions than Friday. Fewer people use the roads on Sundays, and those who do generally have shorter journey distances, so traffic is lower overall.
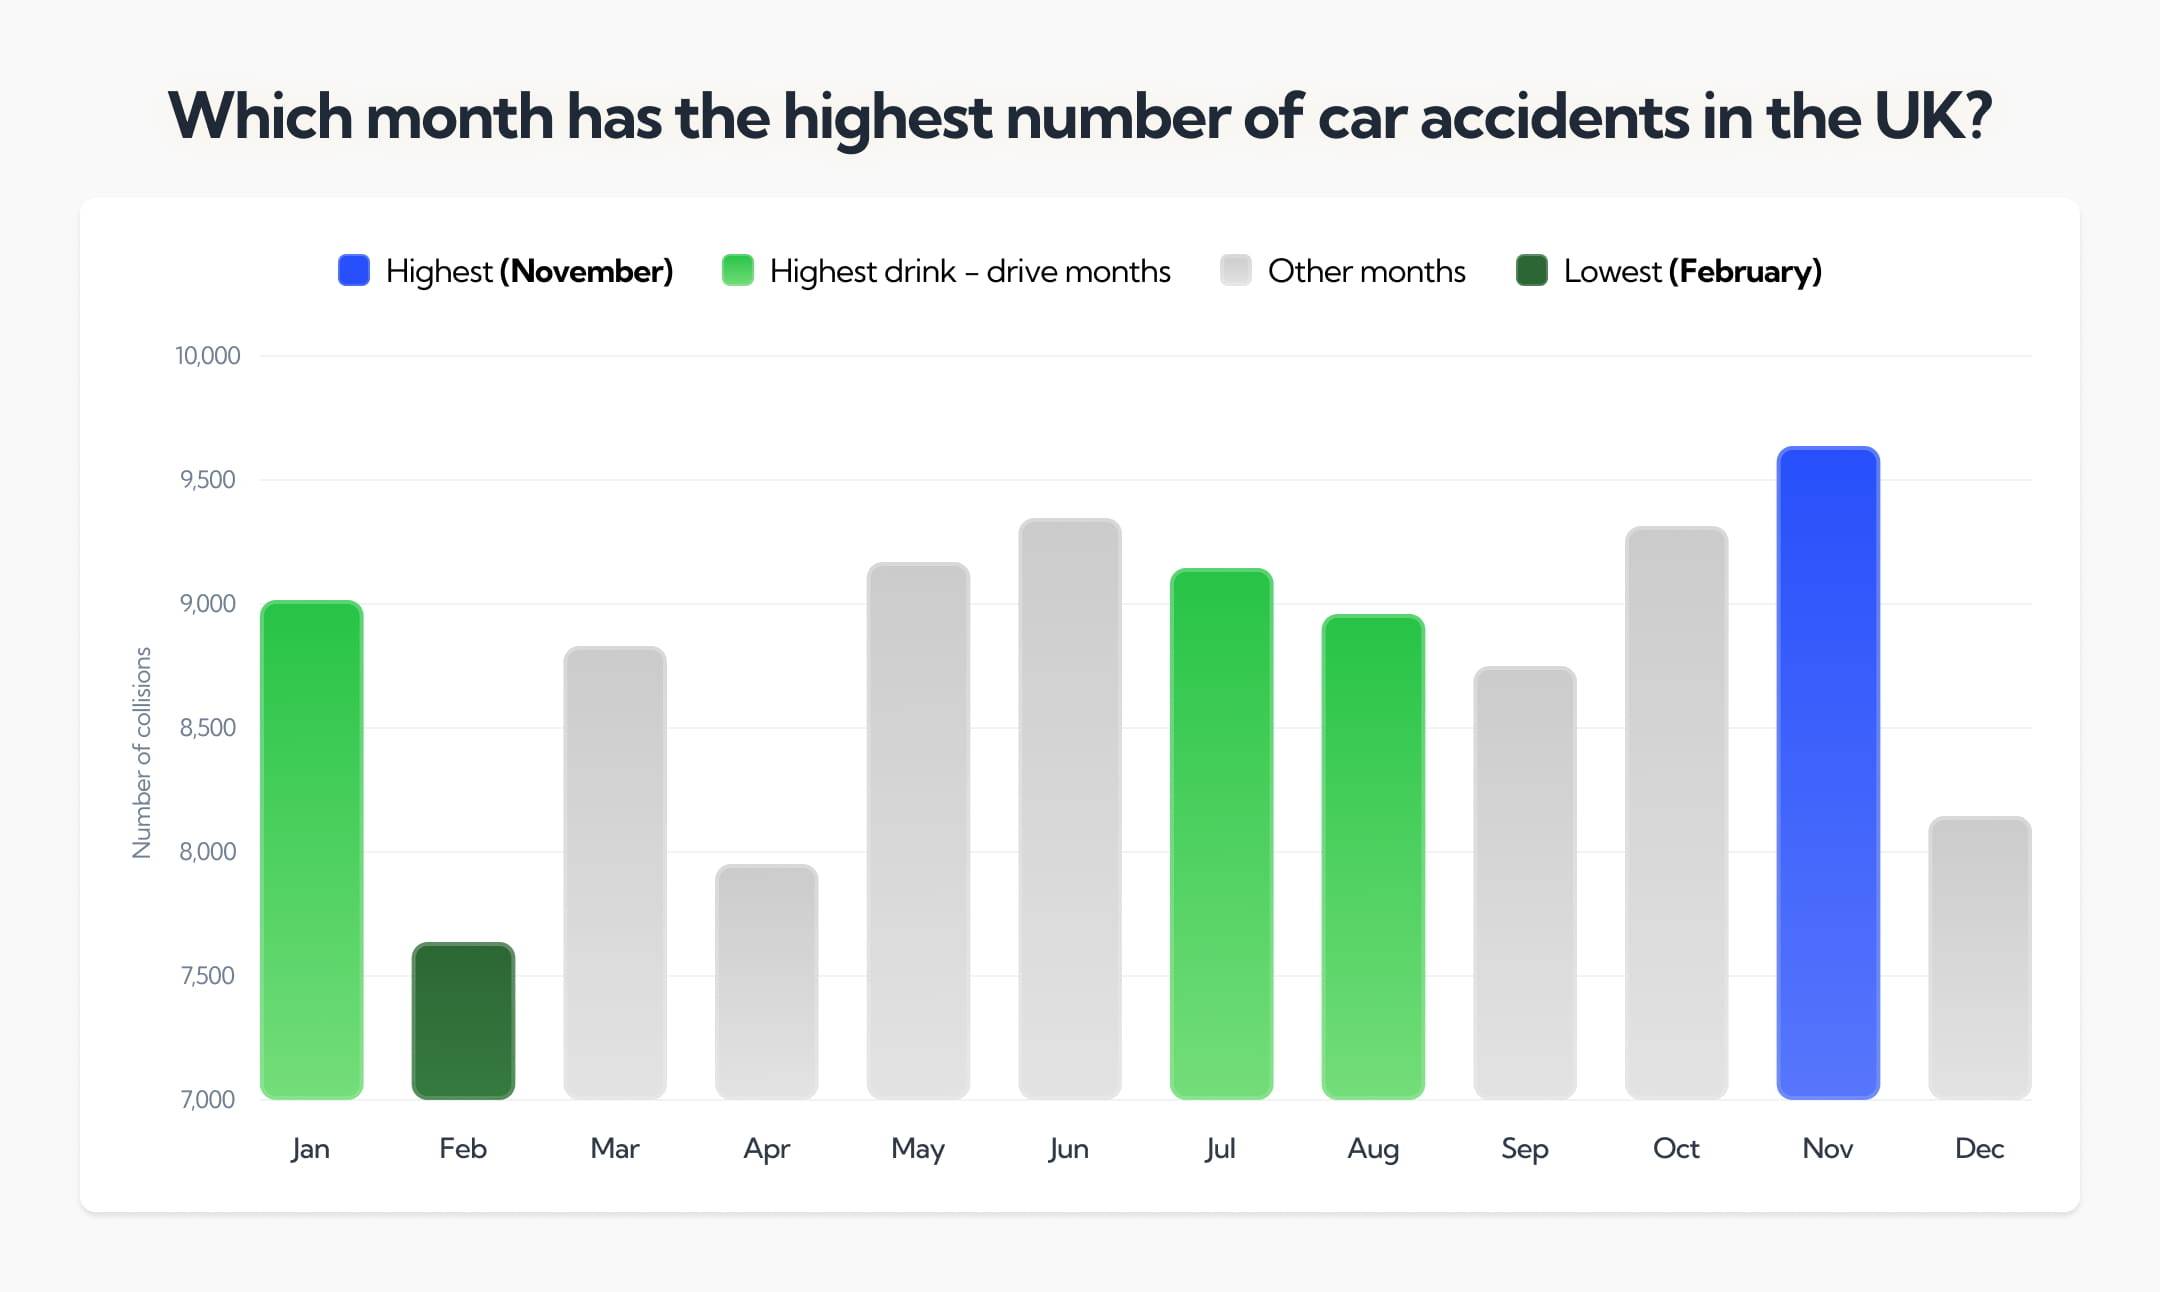
Which month has the highest number of car accidents in the UK?
November is the most dangerous month on UK roads, with 9,592 collisions recorded. June and October follow closely, with 9,349 and 9,334 collisions, respectively.
The winter spike in November is driven by reduced daylight, wetter roads and drivers adjusting to deteriorating conditions after the summer. February is the safest month with 7,678 collisions, likely reflecting lower traffic volumes and fewer long leisure journeys.
Drink-drive collisions tell a slightly different story — January, July and August see the highest estimated rates, reflecting New Year celebrations and peak summer socialising.
UK car accident statistics by season
These daily, monthly and yearly averages are useful for communicating scale, but they smooth over real variation across the year. Weather conditions – good and bad – have a serious impact on how likely you are to be involved in a car accident at particular points in the year. Holidays play a role, too.
How do winter conditions affect car accident rates in the UK?
Winter brings reduced visibility, icy surfaces and more hours spent driving in darkness, all of which contribute to more casualties on the road. In some cases (e.g. with ice on a high-speed road) they make an accident unavoidable. The RAC Foundation notes that the October clock change also leads to increased collisions due to suddenly darker evenings.
How many car accidents happen during the Christmas period in the UK?
- December 2023 saw 49,243 breath tests — 138% higher than the monthly average.
- During Op Limit (Dec 2024): 14.5% of post-collision tests positive for alcohol — highest since 2019.
How does summer affect car accident rates in the UK?
Summer months see an uptick in traffic, which leads to a proportional increase in total per-day accidents. On top of that, June and July have highest drink-drive casualty levels, which results in more car accidents from that.
Car accident injury statistics in the UK
While road collisions kill, they injure far more. Behind the fatality figures lies a much larger population of people dealing with serious and life-changing injuries, many of whom never fully recover.
Below, we’ll dive into the scale of that problem:
How many people are seriously injured in car accidents each year?
In 2024, 27,865 people were seriously injured in reported car accidents across Great Britain, a number that’s broadly unchanged from 2023. Car occupants accounted for 11,044 of those, which is the largest share of any road user group.
The longer-term trend offers modest encouragement, though: serious injuries are down 3% since the pre-pandemic baseline of 29,530 in 2019, though progress has been slow compared to the reduction in fatalities over the same period.
What are the most common injuries in UK car accidents?
Whiplash – a soft tissue injury to the neck caused by sudden forward and backward movement of the head – is by far the most common car accident injury in the UK. According to NHS data, it accounts for the vast majority of personal injury claims following road collisions.
Beyond whiplash, the most frequently recorded injuries include broken bones (particularly arms, legs and ribs), concussion and traumatic brain injury, chest injuries from seatbelt and airbag impact, and spinal injuries ranging from herniated discs to paralysis in the most severe cases.
The DfT's injury severity classifications (slight, serious and fatal) cover a wide spectrum, with ‘serious’ encompassing anything from a fracture requiring hospitalisation to life-altering neurological damage.
How many suffer minor injuries in car accidents each year?
In 2024, 98,805 people sustained slight injuries in road collisions in Great Britain. That number’s down 4% on 2023 and 38% lower than the 2014 figure.
Slight injuries include whiplash, sprains, minor cuts and bruises where the casualty does not require hospital admission as an inpatient. The long-term decline in this category has driven most of the overall improvement in GB casualty numbers over the past decade.
Vulnerable road user accident statistics in the UK
A ‘vulnerable road user’ is anyone who lacks the protective shell of a vehicle. That includes pedestrians, cyclists, motorcyclists, horse riders and mobility scooter users. They account for a disproportionate share of deaths and serious injuries relative to their traffic volume, and consistently face the highest per-mile risk of any group on UK roads.
Motorcycle accident statistics in the UK
Motorcyclists make up just 1% of road traffic but account for 21% of all road deaths. The fatality rate for motorcyclists stands at 115.2 per billion miles, which is roughly 43 times higher than for car occupants. It’s the most disproportionate risk profile of any road user group in the UK.
Key figures from Department for Transport’s 2024 data:
- 340 motorcyclists killed, up 8% on 2023, though broadly unchanged since 2014
- 5,465 seriously injured
- 15,960 total casualties, down 6% on 2023
Their all-casualty rate of 5,408 per billion miles dwarfs every other road user group. So, put simply, no other legal way of getting around carries anything close to the same fatality risk.
Also noteworthy is that nearly a quarter of motorcyclist deaths in the reporting period occurred in single-vehicle accidents. And among young riders aged 16 to 24, 70 were killed and 1,631 seriously injured. In addition to the same extreme physical vulnerability that affects motorcyclists at every age, young motorcyclists have two things working against them: limited experience and higher risk-taking tendencies.
Pedestrian accident statistics in the UK
Pedestrians are among the most vulnerable groups on UK roads, with 409 killed, 5,823 seriously injured and 19,176 all-severity casualties in 2024. Older pedestrians (60+), who accounted for 47% of all pedestrian fatalities, are particularly at risk.
Though these figures are up 1% vs 2023, and casualty rates dropped sharply during COVID lockdowns and haven’t returned to pre-pandemic levels, pedestrian infrastructure is safer than it was. The most recent reported fatality rate is 26.4 per billion miles walked, which is 30% lower than it was in 2014.
Cycling accident statistics in the UK
DfT reported that in 2024, 82 cyclists were killed on GB roads, with a further 3,822 seriously injured and 14,549 injured overall, accounting for all levels of severeity. The most lethal collision type involves HGVs, mainly due to their size and weight. Although relatively rare in absolute terms, 5.8% of fatal cycle collisions involve a heavy goods vehicle.
The long-term trend is genuinely encouraging, though. Cyclist fatalities are down 27% since 10 years prior, and the overall casualty rate has fallen 36% since 2004. It’s the greatest sustained improvement of any road user group over that period.
E-scooter accident statistics in the UK
In 2024, 1,214 people were hurt in collisions involving e-scooters, with four riders killed, 394 seriously injured and 816 slightly injured. E-scooters have become an increasingly visible category in UK road casualty data since trial schemes began rolling out across the country.
The broader vehicle category that includes e-scooters has seen a 102% rise in casualties since 2014. That’s the largest increase of any road user group over the decade, and it’s a result of both growing use and the vulnerability of riders who don’t wear protective gear.
As of now, e-scooters are still illegal on public roads outside of government-sanctioned trials, though enforcement is inconsistent and legislation to regularise their status has been repeatedly delayed.
What to do after a car accident in the UK
Now… being involved in a collision is disorienting, knowing the steps you need to take in the aftermath will protect your safety, your legal position and future insurance claims you have to make.
Here's what the law requires and what common sense recommends:
What should you do immediately after a car accident?
If you're involved in a collision, the priority is safety and information — in that order:
- Stop: You are legally required to stop at the scene of any collision involving injury, another vehicle, an animal or property.
- Check for injuries: Assess yourself, your passengers and anyone else who’s involved. Call 999 immediately if anyone is hurt or if the road is blocked.
- Switch on hazard lights: Warn oncoming traffic and, if it's safe to do so, place a warning triangle behind the vehicle.
- Move to safety: Get away from the carriageway if you can, especially if the accident happened on a fast road.
- Exchange details: Get the name, address, vehicle registration and insurance details of every other driver who was involved in the incident.
- Document everything: Take photos of the scene, vehicle positions, damage, road conditions, visible injuries and relevant signs and road markings.
- Gather witness details: You’ll also want the names and contact numbers of anyone who saw what happened.
Do not admit fault or apologise at the scene, even informally, as this could potentially affect the insurance and legal proceedings that follow.
What to do after a minor car accident in the UK
If nobody is injured and vehicles are driveable, you can usually resolve a minor collision without involving the police. You still need to exchange names, addresses and insurance details with the other driver, though – failing to do so is a criminal offence under the Road Traffic Act 1988.
Take clear photographs of both vehicles and any damage before moving them. Note the time, date, location and weather conditions. If there are witnesses, get their details. Even if the damage looks trivial, report the incident to your insurer promptly because UK auto insurers almost universally require notification regardless of whether you intend to make a claim.
When should you report a car accident to the police?
Under the Road Traffic Act 1988, you must report a collision to the police within 24 hours if anyone was injured, or if you were unable to exchange details with the other driver at the scene. You can do this at any police station.
If the collision involved an animal (but not a cat or bird), damage to property such as a wall or lamppost, or a vehicle that was unattended, you are also required to report it. In serious collisions where police attend the scene, they will record the details themselves.
How to report a car accident to your insurance company
If you don’t reach out to your insurance company ASAP, delay might complicate (or invalidate) a claim. When you call, have the following ready:
- The date, time and location of the collision
- The other driver's details and registration
- Your photographs
- Witness information, if there is any
Be accurate and factual in what you report. And again, do not speculate about fault or make admissions, even to your own insurer. Their legal team will assess liability based on the evidence.
Car accident compensation and claims statistics in the UK
Road collisions generate one of the largest streams of personal injury claims in the UK legal system. Understanding the scale of claims activity, and what drives it, puts the human and financial cost of road accidents into sharper focus.
How many car accident claims are made in the UK each year?
Road traffic accidents account for around half of all personal injury claims in the UK. The Compensation Recovery Unit recorded 348,806 motor injury claims in the year to March 2024.
Whiplash drives the bulk of volume. The ABI estimates over 1,500 claims are filed daily, which costs insurers more than £2 billion every year and adds around £90 to the average car insurance premium.
The 2021 Whiplash Reform Programme introduced fixed tariffs for soft tissue injury claims under £5,000 and a dedicated Online Injury Claim portal, in an effort to reduce fraud and cut premiums, though the savings have not yet been fully passed on to policyholders.
That said, only around 30% of people injured in collisions actually make a claim. So the true volume of compensable injuries is significantly higher than official figures capture.
What is the average compensation payout for a car accident?
Compensation amounts vary enormously depending on injury type, severity and the financial losses involved. Courts and solicitors use the Judicial College Guidelines (17th Edition, April 2024) as the starting point for general damage. This covers pain, suffering and loss of amenity.
The figures below are general damages only and don't include lost earnings or medical costs, which are calculated separately.
Awards across most injury categories rose by around 22% in the 2024 edition of the guidelines, but this is in line with accumulated inflation since the previous edition in 2022. Also, the figures in the table cover general damages only — total settlements climb further once lost earnings, rehabilitation costs and other out-of-pocket losses are added.
How long after a car accident can you make a claim?
Under the Limitation Act 1980, the standard time limit for making a personal injury claim is three years from the date of the collision. For anyone under 18 at the time, the clock doesn't start until their 18th birthday, giving them until they turn 21.
Starting earlier is always a good idea, though. That’s when the evidence is fresher and witnesses are easier to trace. It’s also when medical records are going to be the easiest to obtain.
UK road safety statistics and trends
The UK has made remarkable progress on road safety over the past two decades, but that progress has largely stalled in more recent times. Understanding where the gains came from, and why they've stopped, is one of the more important questions in road safety policy.
How have UK road safety statistics changed over the years?
Road fatalities in Great Britain dropped from over 3,000 in 2004 to 1,602 in 2024. The reduction of nearly 50% in two decades is driven by a combination of safer vehicles, stricter enforcement policies and better road design.
However, outside the COVID dip, fatalities have been flat since around 2010, and serious injuries have barely shifted. The easy gains have been made, and what remains are the harder behavioural and political problems that no one’s yet managed to solve.
What impact have speed limits had on UK car accident rates?
Wales introduced a default 20mph limit on residential roads in September 2023. It was the most significant speed policy change in Britain in decades and one of the few nationwide urban defaults below 30mph anywhere in the world.
Brake campaigns for the same approach across England, Scotland and Northern Ireland, citing evidence that lower urban speeds reduce both collision frequency and severity. Whether the political will exists to follow Wales's lead across the rest of the UK remains an open question.
How has drink driving legislation affected UK road safety?
The data makes a clear case for enforcement. Between 2009 and 2019, drink-drive collisions fell by 34%, while convictions dropped 55% between 2005 and 2024. Tougher enforcement and a genuine shift in social attitudes toward drink driving over that period helped reduce it dramatically.
The concern is what's happened since. Drug driving has risen sharply to partially fill the gap, and self-reported drink driving among under-25s has crept back up in recent years.
The legislative framework hasn't changed, either. England and Wales still have one of the highest legal limits in Europe at 80mg per 100ml of blood, compared to 50mg across most of the EU and 20mg in Scotland.
What role has vehicle safety technology played in reducing car accidents?
From July 2024, the EU General Safety Regulation made Intelligent Speed Assistance, Automatic Emergency Braking, lane-keeping systems and event data recorders mandatory in all new vehicles sold in Europe, with the UK broadly mirroring these requirements.
As the vehicle fleet turns over, the cumulative effect will be significant. AEB has already shown measurable reductions in rear-end and pedestrian collisions in real-world data, and its mandatory rollout represents one of the most impactful passive safety interventions since the seatbelt.
UK vs international road safety comparison
The UK is one of the safest countries in the world for drivers. With 24 road deaths per million population in 2024, Great Britain ranked 4th out of 36 countries, and well below the EU average of 44 per million.
According to the European Transport Safety Council’s 19th Annual PIN Report, the Vision Zero countries set the standard: Sweden at 20 per million and Norway at 16 – 33% lower than the UK. At the other end, Romania and Bulgaria both exceed 74 per million, which goes to show the gap between Western and Eastern European road safety investment and enforcement.
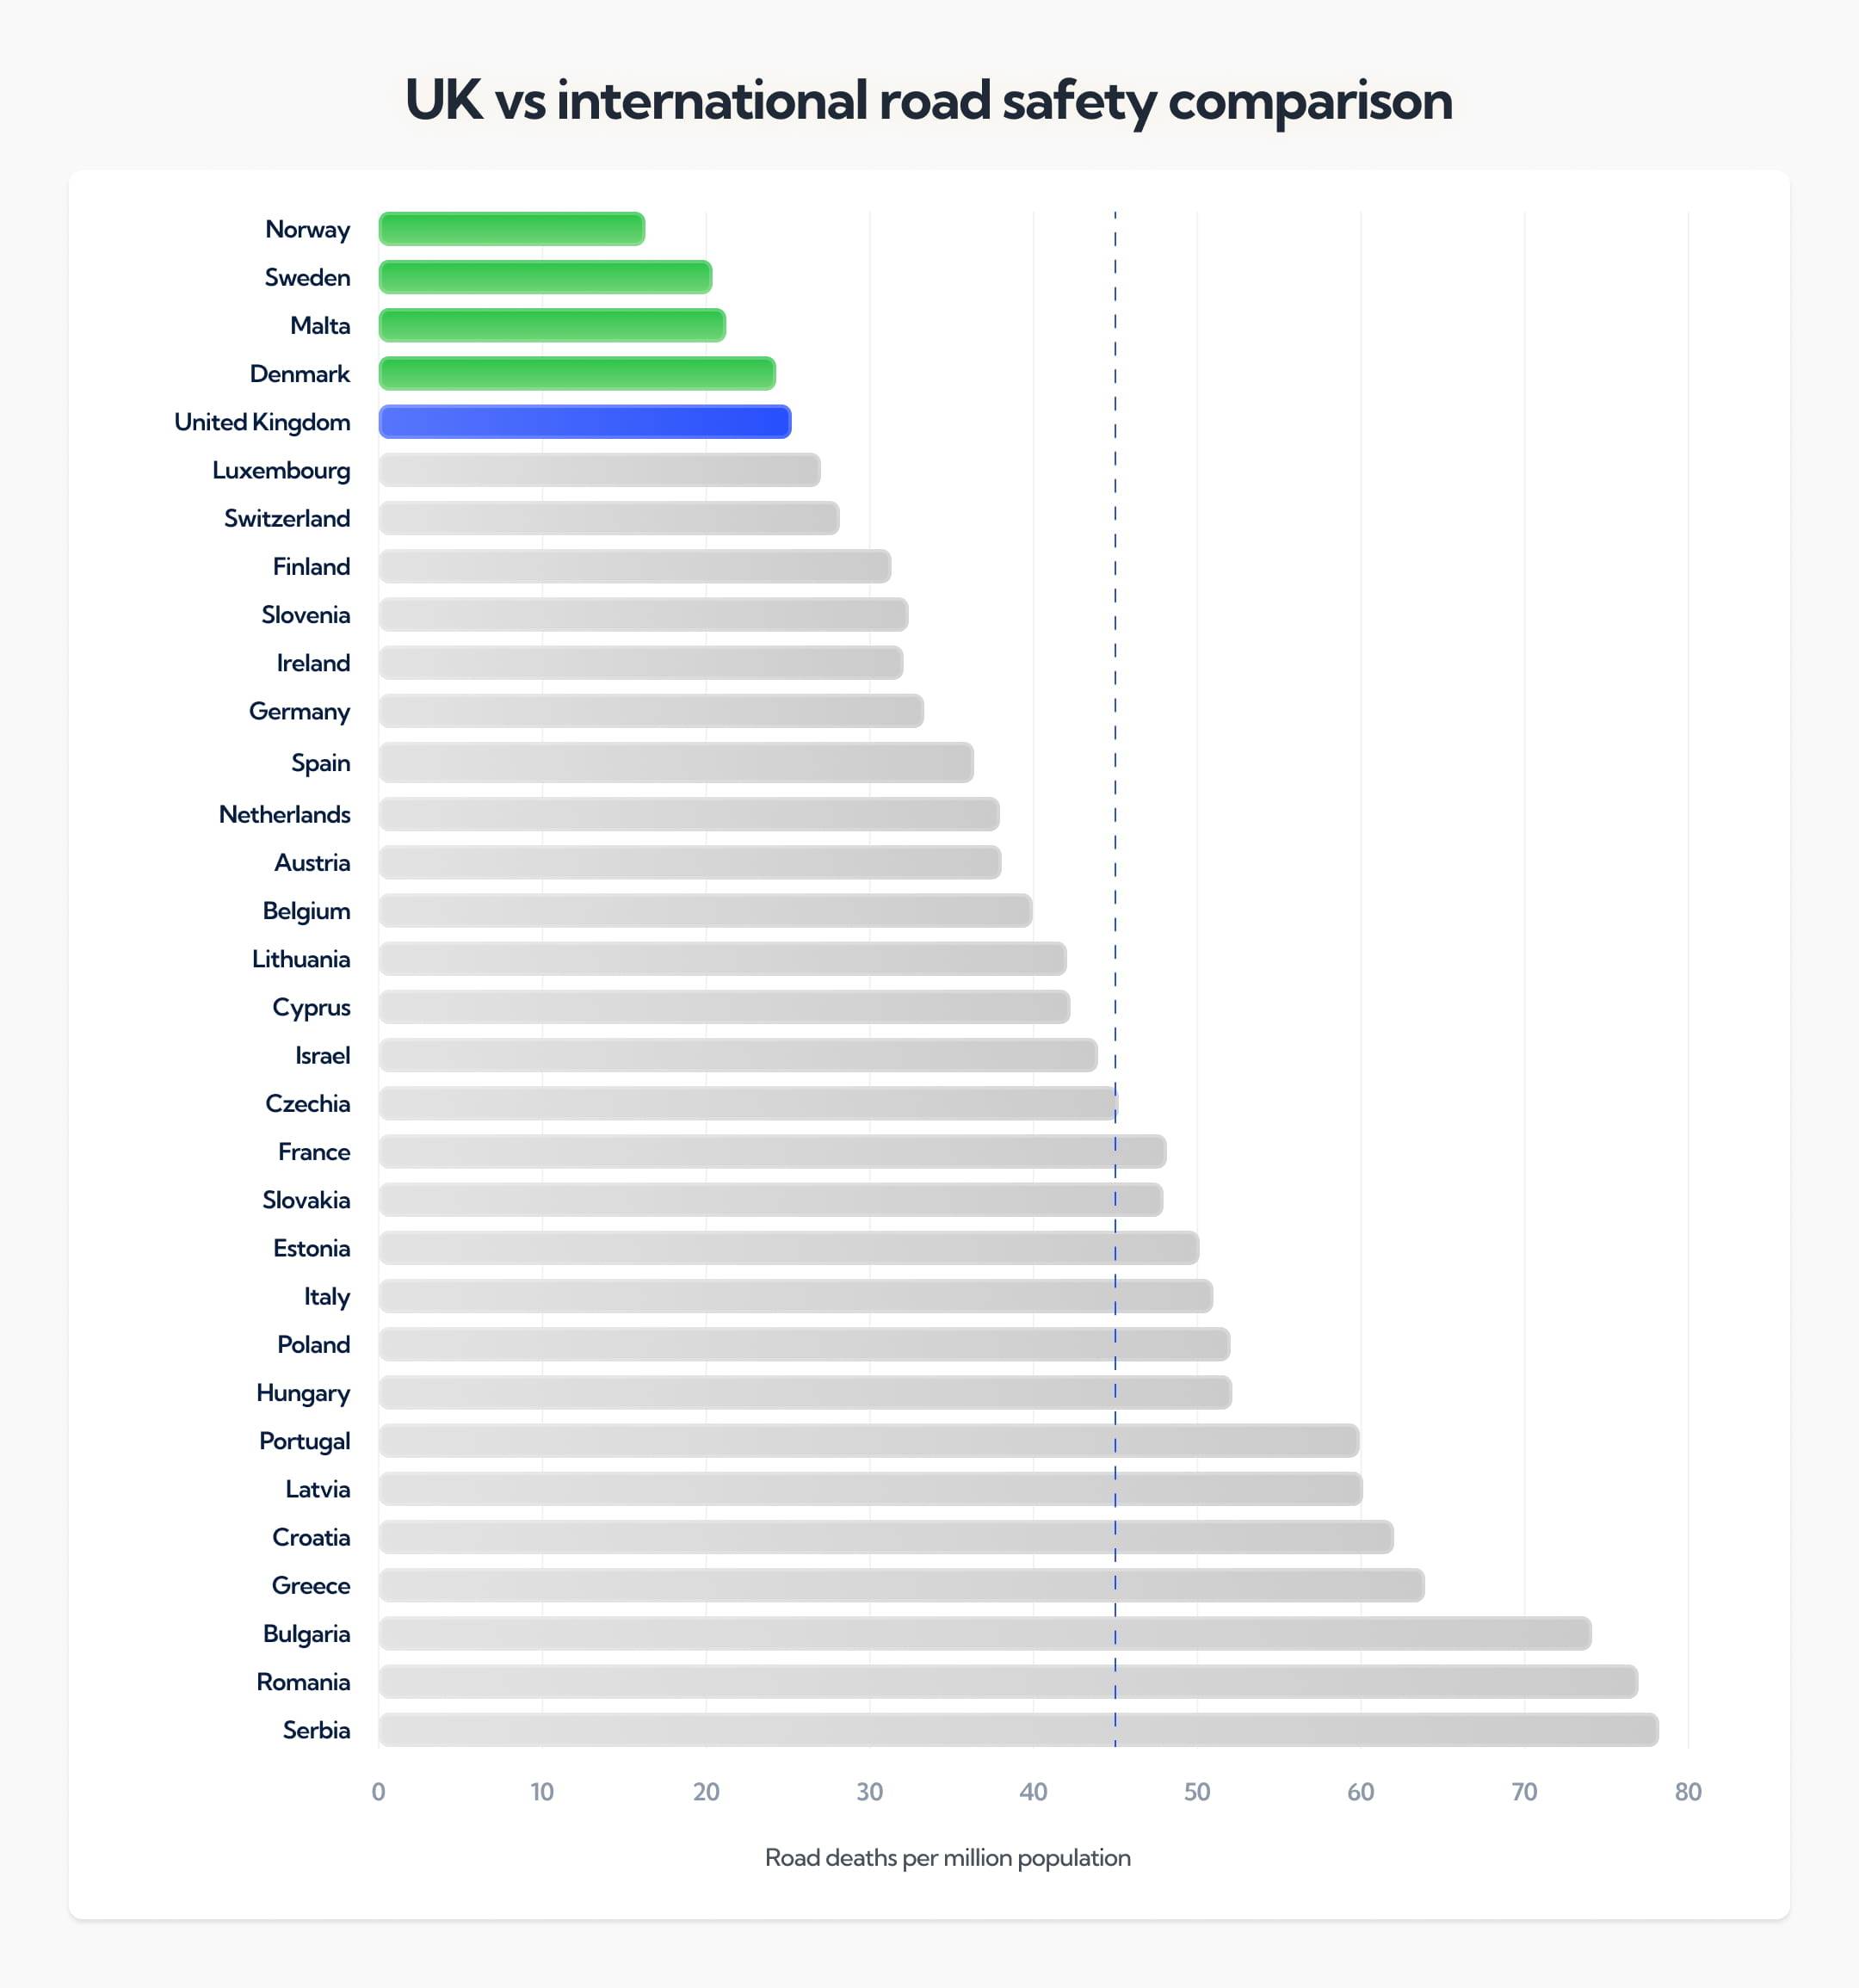
Globally, the WHO estimates 1.19 million people die in road crashes every year, making the UK a bit of an outlier in the best possible sense.
Future predictions for road accident statistics in the UK
Traffic has already returned to roughly 340 billion miles a year in Great Britain, back to pre-pandemic levels. That means any real drop in accidents won’t come from fewer cars on the road. It’ll come from safer systems around them.
Right now, three forces are shaping what happens next:
- Policy: A new UK road safety strategy is now in focus.
- Technology: Advanced driver assistance is becoming standard.
- Data: Long-term crash mapping is guiding where money gets spent.
Countries like Norway show what’s possible. With around 16 deaths per million people, they’ve set a benchmark that proves sustained investment actually moves the needle.
The government's road safety strategy
This looked like a future promise a few months ago. Now it’s an actual policy. After road safety was pushed up the agenda in a House of Lords debate on 19 November 2025, the government published a new road safety strategy in January 2026, with a target to cut people killed or seriously injured on Britain’s roads by 65% by 2035.
That matters because strategy tends to shape where money and attention go. Brake and other campaigners have spent years calling for a clearer national plan, so the real question now isn’t whether the UK needs one. It’s whether the measures behind it are funded, enforced and updated fast enough to move the numbers in a meaningful way.
And in the case of London specifically, the Road Safety Foundation's crash risk mapping has identified £2.5bn of investment opportunities on A-roads capable of preventing over 17,000 deaths and serious injuries over 20 years.
How will autonomous vehicles affect road accident statistics?
Fully self-driving cars get the headlines. But they’re not the main story (at least not yet). The real impact is already happening through driver assistance features, now being built into new vehicles as standard:
- Automatic emergency braking
- Intelligent speed assistance
- Lane-keeping systems
- Event data recorders
These systems don’t eliminate human error, but they reduce the margin for it. So instead of a sudden drop in accidents, what’s more likely is a gradual shift: fewer high-speed collisions, fewer rear-end crashes and fewer moments where a simple mistake turns serious.
Fully autonomous vehicles may change the picture later, but for now, Level 2- and Level 3-style assistance systems look far more likely to bend the curve first. Boring answer, maybe. Probably the correct one.


How road accident data is collected in the UK
Nearly all official road accident data in the UK comes from a single system: STATS19. It’s the standard reporting framework used by police forces, where officers record details of any injury-related collision they attend, from location and vehicles involved to the circumstances surrounding the crash.
That said, it’s not a complete picture. There’s no requirement to report every incident, especially minor ones, so the headline numbers tend to understate the true scale of what’s happening on the roads.
The system itself is also evolving. A recent update replaced older “contributory factors” with a newer framework designed to better reflect what led to a crash. Early adoption has been gradual, with only around a quarter of cases recorded using the new method initially, and the rest adapted from the previous approach.
To keep trends consistent over time, adjustments are also applied to account for changes in how injury severity is recorded, which helps make sure year-on-year comparisons still hold up.
The economic cost of road accidents in the UK
It’s easy to think of car accidents as isolated events. A crash happens, insurance deals with it, life moves on. But zoom out, and you start to see something very different: road collisions quietly drain huge amounts from the UK economy every single year.
In fact, the total cost runs into the tens of billions each year once you include healthcare, lost productivity and wider societal effects in the equation. Government modelling places the cost of a fatal road accident at a different value depending on the severity:
- Fatal casualty: £2.8M, plus or minus depending on year and inflation adjustments
- Serious injury: ~£325K per case
- Slight injury: £25K to £35K range
Some estimations push it higher, though. For instance, data from UK insurer WeCovr calculates that the average serious accident costs £3.5 million when it’s all said and done.
Safety tips to prevent car accidents in the UK
Avoiding a car accident really comes down to your personal driving habits and your ability to navigate the driving situation around you. Of course, there are things that happen outside your control, but the following tips will dramatically reduce your odds of getting involved in one:
Stick to speed limits: Speed is a factor in 59% of UK road deaths. The limit is a maximum, not a target.
- Put the phone away: If you need to make a call, pull over. Mobile phone use remains one of the most underreported causes of fatal collisions. It’s just not worth it.
- Drive to the conditions: Slow down when you’re driving in rain, ice and fog regardless of the posted limit. Wet roads alone feature in thousands of collisions every year.
- Take breaks on long journeys: Fatigue contributes to 10-20% of crashes and one in eight drivers have fallen asleep at the wheel. The Highway Code recommends a 15-minute break every two hours.
- Check your mirrors for vulnerable road users: Cyclists and motorcyclists are easy to miss, particularly at junctions and when turning. A collision at low speed can still prove fatal for an unprotected rider.
- Always wear your seatbelt: 25% of car occupant fatalities in 2024 involved someone who wasn't belted in. It remains the single most effective thing you can do to survive a crash if you are involved in one.
About Car.co.uk

Share on
Latest news & blogs